
Figure 4.
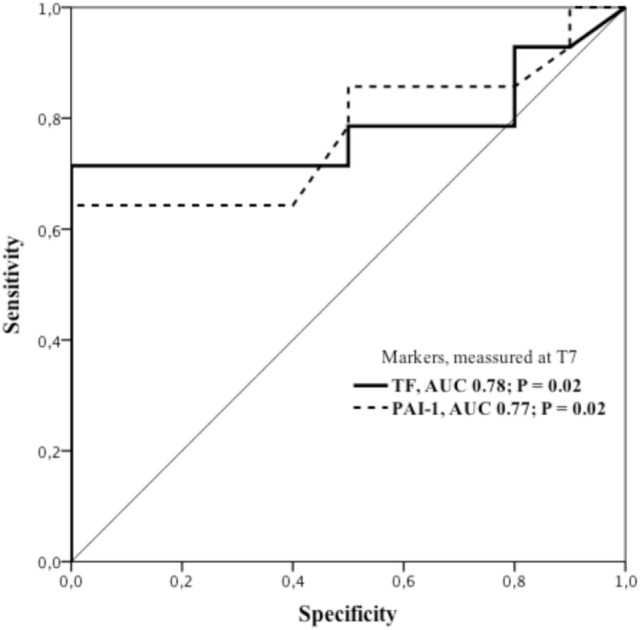
ROC curves showing sensitivity and specificity of tissue factor and plasminogen activator inhibitor-1 for ARDS diagnoses on the seventh day (T7) of ICU stay. ARDS group displaying 71% sensitivity and 100% specificity for association with plasma concentration of TF. Cut off value: 145 pg/ml; AUC 0.782; p = 0.021; 95%CI: 0.586–0.979. Correspondingly, plasma concentration of PAI-1 showed sensitivity and specificity of 64 and 100%, respectively, and a cut off value of 117.5 pg/ml; AUC 0.775; p = 0.024; 95%CI: 0.584–0.966. AUC, area under the curve; 95%CI, 95% confidence interval; PAI-1, plasminogen activator inhibitor-1; ROC, receiver operating characteristics; TF, tissue factor.