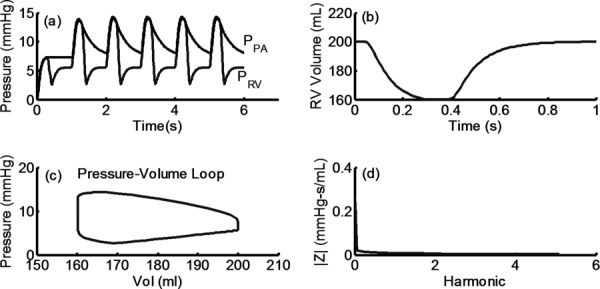
Fig. 3.

(a) Typical RV and PA pressure waveforms computed using RV–PA axis model. (b) and (c) Ventricular volume and ventricular pressure–volume loop, respectively. (d) Pulmonary vascular impedance in the frequency domain, computed using simulated PA pressure and flow waveforms as outlined in Ref. [2]. Note: PPA and PRV are pulmonary and RV pressure, respectively.
