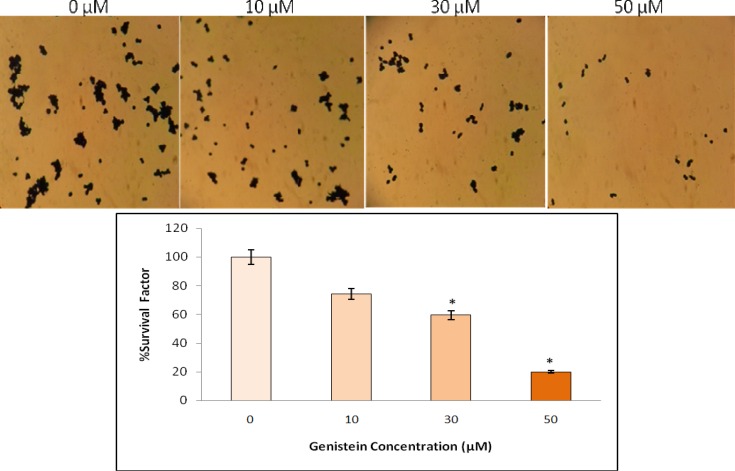
Fig. 3.
The effects of genistein on the proliferation of HT29 cells analyzed by colony formation assay. Cells were plated and treated with 0, 10, 30 and 50 µM genistein for one week. The number of colonies was determined, plating efficiency was calculated and the percentage of survival factor was obtained. Figure shows the stained cultured cells (top) and survival factor (%) based on different concentration of genistein (bottom). One-Way-ANOVA analysis was performed to compare the differences between groups and the symbol (*) represents significant differences (P< 0.05) between groups compared to untreated cells

