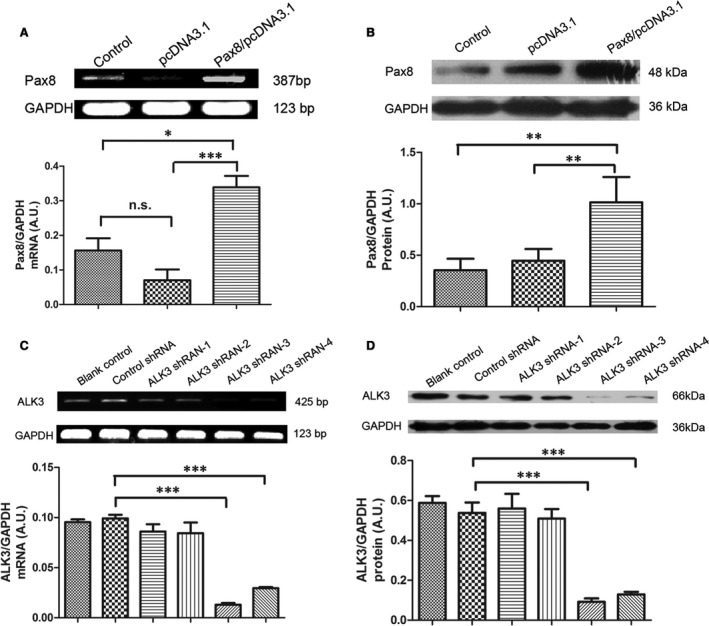
Figure 1.

Pax8 overexpression and ALK3 down‐expression in H9C2 cells. (A) Pax8 mRNA expression was analysed using semi‐quantitative Real‐time PCR. Pax8/pcDNA3.1 was transfected in cells for 24 hrs. The pcDNA3.1 alone was used as negative control. (B) Pax8 protein level was quantified by Western blot analysis. (C) ALK3 mRNA level in H9C2 cells. (D) ALK3 protein level in H9C2 cells transfected with ALK3 shRNAs. Note that ALK3shRNA‐3 and ALK3shRNA‐4 significantly silenced ALK3 protein expression. Data are presented as mean ± S.D. *, P < 0.05; **, P < 0.01;***, P < 0.001.
