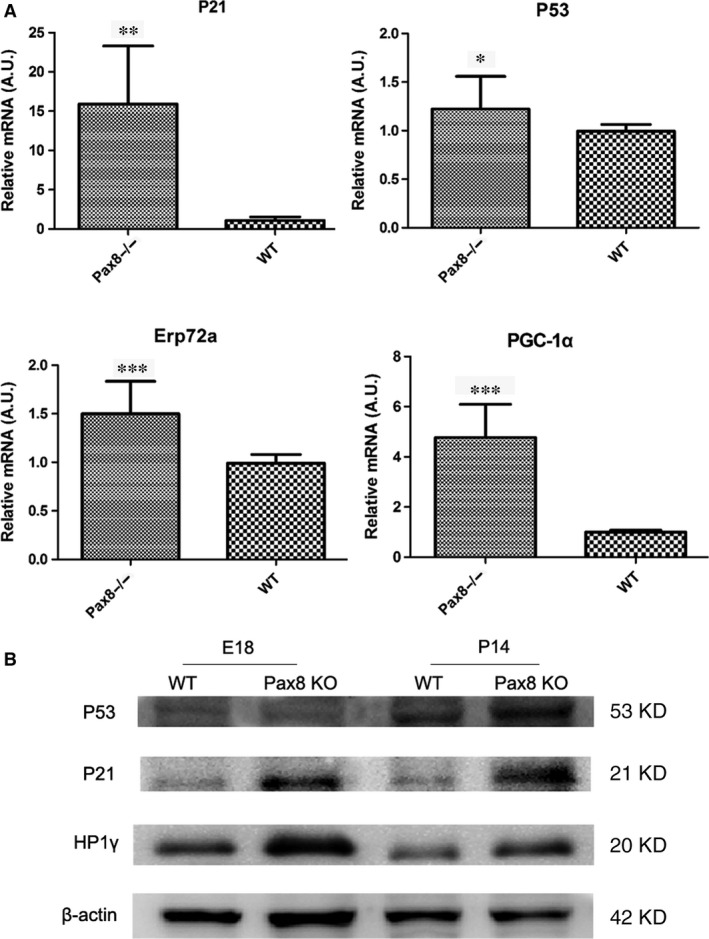
Figure 6.

Quantified mRNA and protein level of senescence‐associated mediators. (A) The mRNA levels of p21, p53, PGC‐1α, and Erp72a by using quantitative RT‐PCR. (B) The bands of Western blot analysis of p21, p53 and HP1γ at E18 embryonic mice hearts and P14 mice hearts. Data are presented as mean ± S.D. *, P < 0.05. **, P < 0.01. ***, P < 0.001.
