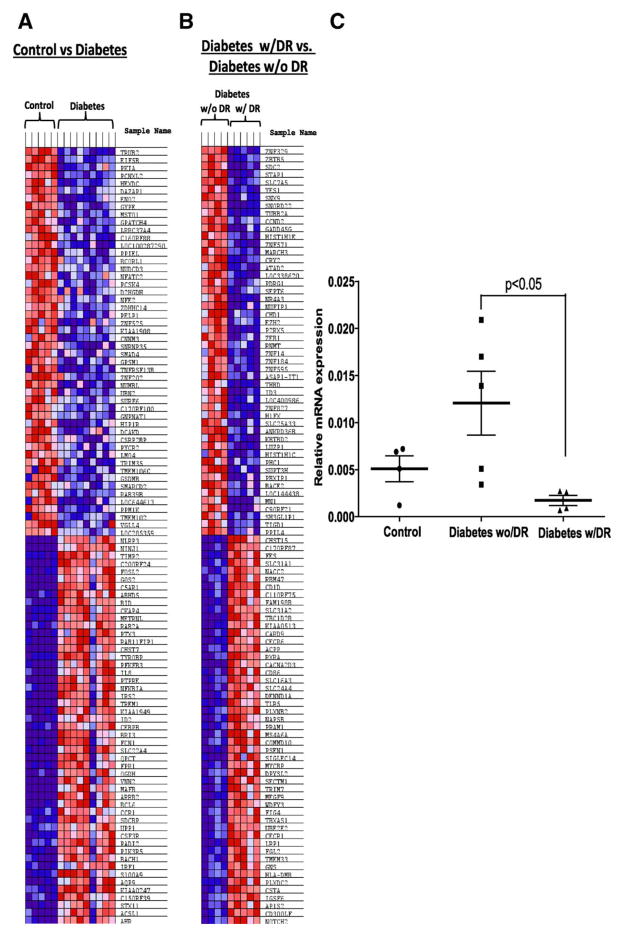
Figure 7.
Diabetic patients protected from microvascular complications map unique targets involved in DNA repair and cell cycle in CD34+ cells. (A): Gene set enrichment cluster analysis showing a heat map exhibiting distinct signature in diabetic group as compared with control. (B): a similar comparison between protected patients from diabetic retinopathy (DR) and patients with DR. (C): Dot plot showing mRNA expression of ataxia telangiectasia mutated in CD34+ cells of study participants; Control (n = 5), Diabetes w/o DR (n = 5), Diabetes w/ DR (n = 4). Statistical test-one way analysis of variance followed by Student’s Newman Keul Test. Abbreviation: DR, diabetic retinopathy.

