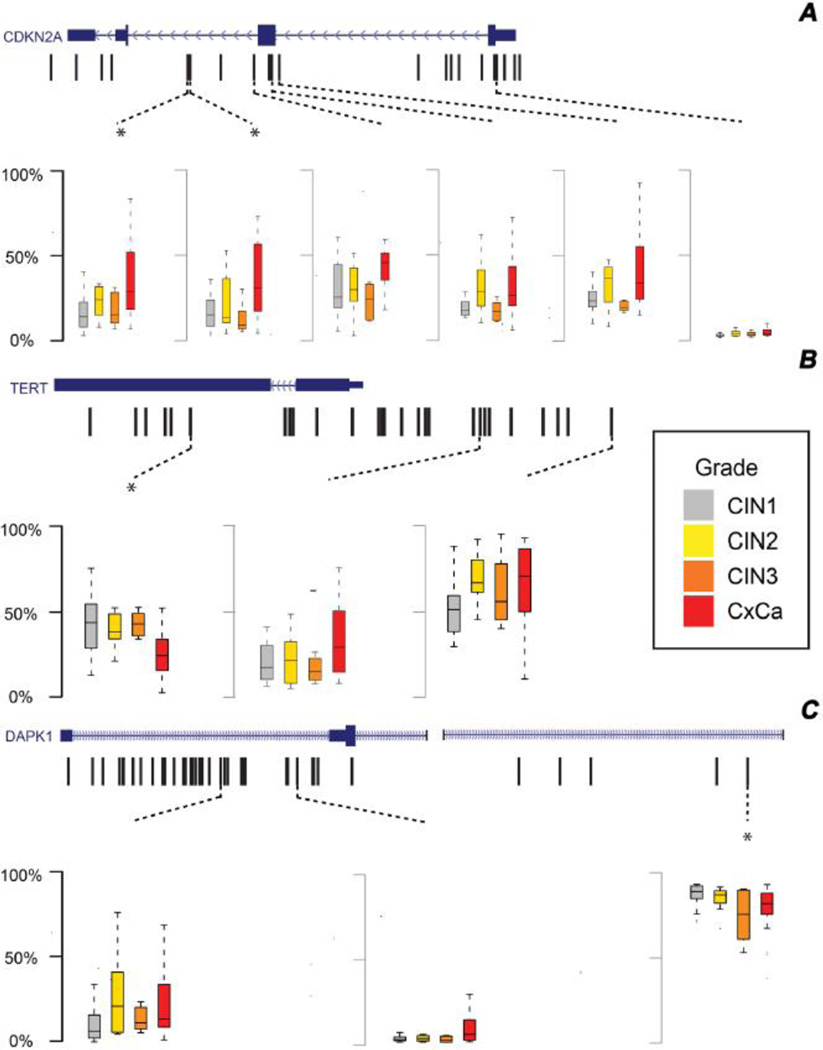
Figure 2.
Gene maps showing CpG loci with significant methylation differences between CIN1, CIN2, CIN3 and cervical cancer samples for (A) CDKN2A, (B) TERT, and (C) DAPK1. Refseq maps for each gene are shown on top, with the CpGs assayed by HELP-tagging indicated by black hash marks. Box plots summarizing median, interquartile range and adjacent percent (%) methylation values are shown below each map for CpGs with significant statistical differences in methylation across lesion groups (uncorrected p<0.05), with comparisons that remained significant after Bonferroni correction marked by an asterisk.

