Figure 5.

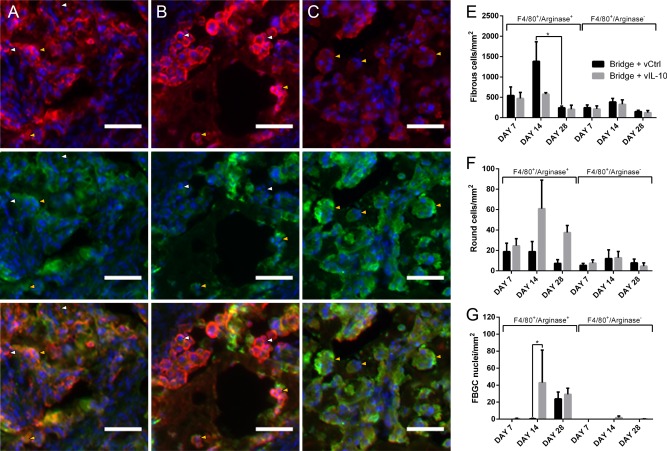
IL‐10 alters macrophage morphology. Immunofluorescence (F4/80+/arginase+/Hoechst+: red/green/blue, respectively), was used to characterize the morphology of infiltrating macrophages within the bridge as either (A) fibrous, (B) round, or (C) FBGC (scale bar 50 µm). Arrows note arginase‐ macrophages (white) and arginase+ macrophages (yellow). (D) Manual quantification of density (cells/mm2) of fibrous macrophages. (E) Manual quantification of density (cells/mm2) of round macrophages. (F) Manual quantification of density (fused nuclei/mm2) of FBGC macrophages. For all quantification, mean +/−SEM was plotted and n ≥3 where each replicate is an average of 1–4 tissues from an individual animal. Statistical analysis was completed on log‐normalized data using a two‐way ANOVA with Šidák correction for multiple comparisons with statistical significance indicated by a single asterisk (p < .05)
