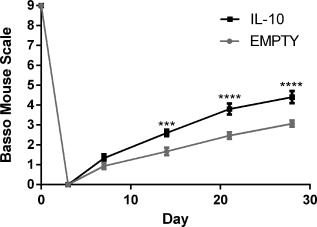
Figure 8.

Functional recovery induced by IL‐10 overexpression. The BMS was used to test for differences in motor function in the hindlimb ipsilateral to SCI (n = 15 per group). Statistical analysis was completed using a two‐way ANOVA with repeated measures and a Šidák correction for multiple comparisons. Significant differences notated with *** (p < .001) or **** (p < .0001)
