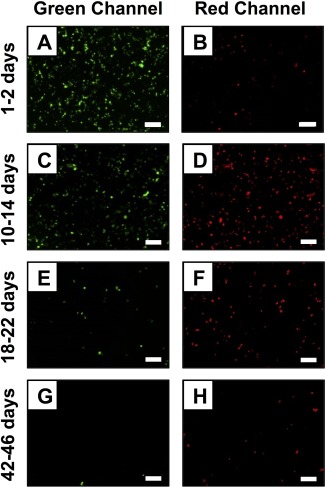
Figure 5.

Representative fluorescence microscopy images showing COS‐7 cells expressing GFP (green channel) and RFP (red channel) after treatment with samples of DNA collected during the erosion of substrates coated with Film 6 (see Figure 2 for additional details of the compositions of these films; see main text and Materials and Methods for additional details for these transfection experiments). The relative levels of GFP and RFP expression observed correspond qualitatively to the amount of each plasmid released from the film during the following time periods: (A‐B) 1‐2 days, (C‐D) 10‐14 days, (E‐F) 18‐22 days, and (G‐H) 42‐46 days. Scale bar = 250 μm. A complete set of images for all time points measured is provided in Figure S1
