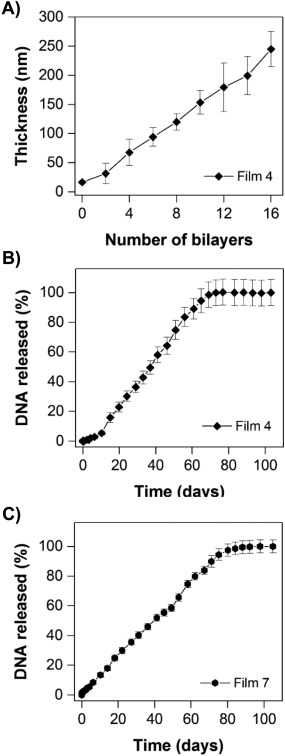
Figure 6.

(A) Plot of film thickness versus the number of polymer/DNA layers deposited on silicon substrates as determined by ellipsometry during the growth of Film 4. (B) Plot showing the release of DNA from substrates coated with Film 4. (C) Plot showing the release of DNA from substrates coated with Film 7. (B‐C) Films were incubated in PBS buffer (pH 7.4, 37°C) and the amount of DNA released was measured by UV/Vis absorbance. In panels (A) and (C), data are presented as the average and standard deviation of multiple measurements made using three identically prepared films. In panel (B), data are presented as the average and standard deviation of multiple measurements made using two identically prepared films
