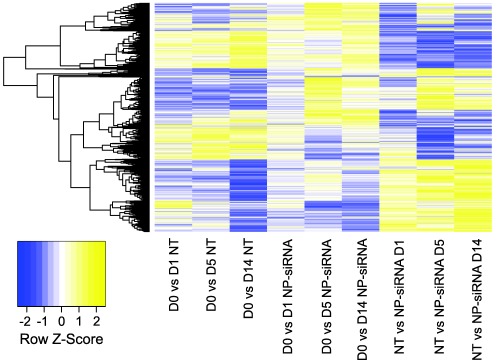
Figure 6.

Differentially expressed genes were determined by comparing gene expression levels of conditions described on x‐axis (∣log2(fold‐change) ∣ > 1 and false discovery rate (FDR) adjusted p‐value of .05). Row‐normalized fold‐changes for all differentially expressed genes (rows) are indicated in the heatmap. Abbreviations: D = day; NT = no treatment
