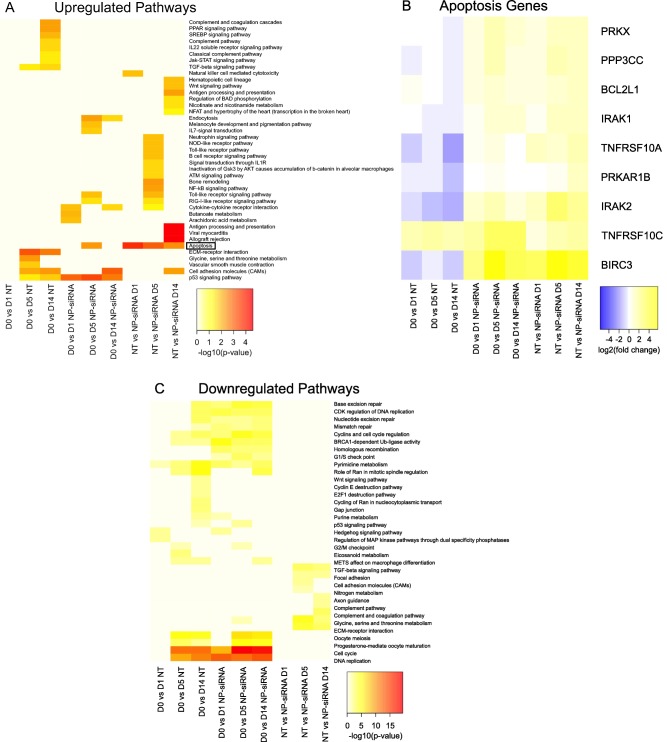
Figure 7.

Effect of long‐term culture and NP‐siRNA treatment on the molecular processes and signaling pathways: Up‐regulated (A) and down‐regulated (C) genes in each comparison (x‐axis) are enriched in the pathways shown on y‐axis. Coloring yellow to red represents low to high enrichment estimated using −log10 (p‐values). Adjusted p‐values are provided in the Supporting Information Table S5. Heatmap of differentially expressed genes within apoptosis (B) enriched signaling pathway, where color refers to log2(fold‐change) in expression (blue indicates down regulation and yellow indicates upregulation). Abbreviations: D = day; NT = no treatment
