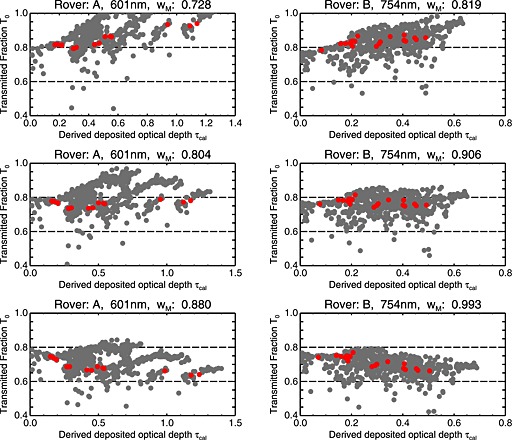
Figure 5.

Scatterplots of T 0 versus τ cal (see discussion in section 3.4). (left column) Data from Spirit's L4 (601 nm) filter and (right column) the Opportunity R2 (754 nm) filter. Each plot shows all data in the N4 data set (see Tables 1 and 2). Each plot shows data from a separate run of the single‐image fit routine on each image in the data set. For each plot a different value of wM was used: (top row) wM too low, (middle row) optimal wM, and (bottom row) wM too high. Red data points are data with 0.72 < τ Atm < 0.77 and 15 < i < 25. This particular range was picked because it is a reasonably narrow range of the control values that still has data points at many different values of τ cal. Thus, it is well suited for demonstration.
