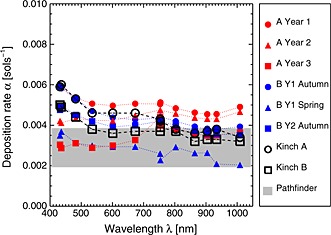
Figure 12.

Derived dust deposition rates for as a function of wavelength for three time periods on each rover as described in 4.3.2, 4.3.3. The dust deposition rate is given as the parameter α, which is defined as the increase in deposited optical depth per sol per unit atmospheric optical depth. Data are based on calm periods with no dust removal: A Year 1: Spirit, first year of the mission, Ls = 330°–130°. A Year 2: Spirit, second year of the mission, Ls = 330°–130°. A Year 3: Spirit, third year of the mission, Ls = 330°–130°. B Y1 Autumn: Opportunity, first year of the mission, Ls = 320°–45°. B Y1 Spring: Opportunity, first year of the mission, Ls = 140°–225°. B Y2 Autumn: Opportunity, second year of the mission, Ls = 320°–45°. The solid red lines in Figure 11 show the fits for the L4 (601 nm) filter and also illustrate the choice of periods. The systematic error due to the uncertainty in the model dust single‐scattering albedo wM is so small that such error bars disappear inside the data symbols. Also shown are results from our previous work [Kinch et al., 2007] for Spirit sols 1–170 (Kinch A) and Opportunity sols 1–150 (Kinch B). The gray band shows the value derived for Mars Pathfinder [Johnson et al., 2003] converted to α using a constant atmospheric optical depth of 0.5.
