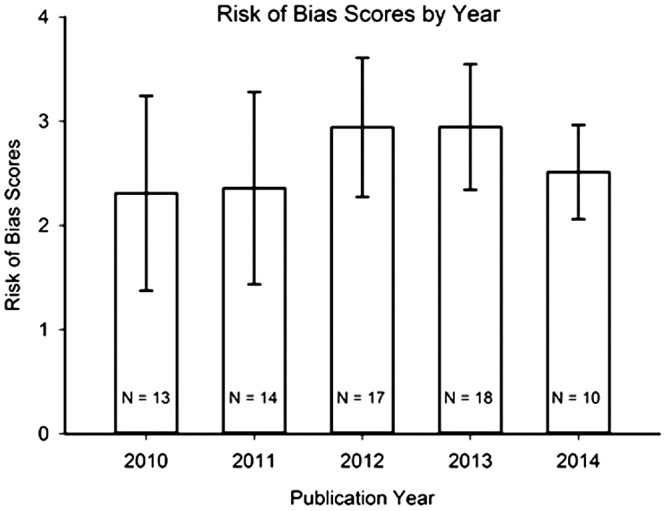
Figure 3.

Risk of Bias scores from Stage 3 of analysis (as described in Results section) of the 72 rated research reports, summarized by publication year. Mean ± Standard Deviation. N = number of research reports in given year. There were no statistically significant differences in Risk of Bias scores across publication years.
