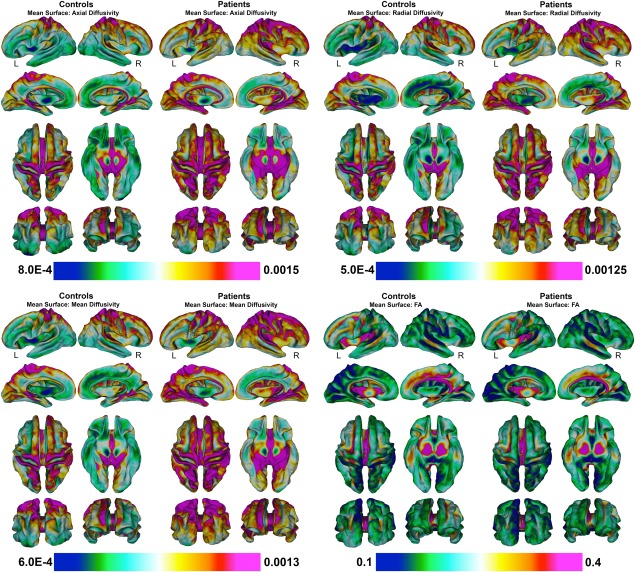
Figure 2.

Mean superficial white matter for patients and controls mapped at high‐spatial resolution at thousands of homologous locations within the superficial white matter. Colorbars indicate the diffusivity value at each vertex of the superficial white matter. Red to purple color indicates higher diffusivity or FA while green to blue color indicates lower diffusivity or lower FA. Legend. MD = mean diffusivity; FA = fractional anisotropy. (Axial/Radial/MD Mean units: 10 − 3 mm2/s).
