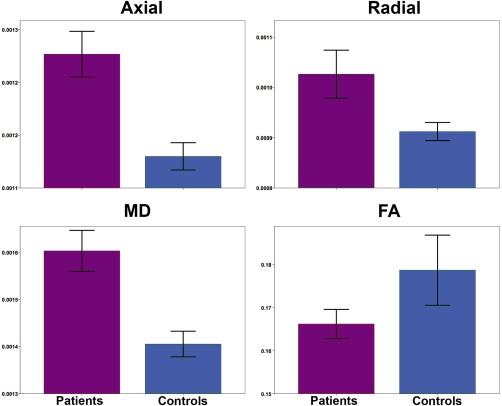
Figure 3.

Bar graphs for average superficial white matter for patients and controls. Bar graphs show significant differences between averagel superficial white matter axial, radial, mean diffusivity and FA. The error bars represent the standard error mean (SEM). Legend. Axial = axial diffusivity; Radial = radial diffusivity; MD = mean diffusivity; FA = fractional anisotropy (Axial/Radial/MD Mean units: 10 − 3 mm2/s).
