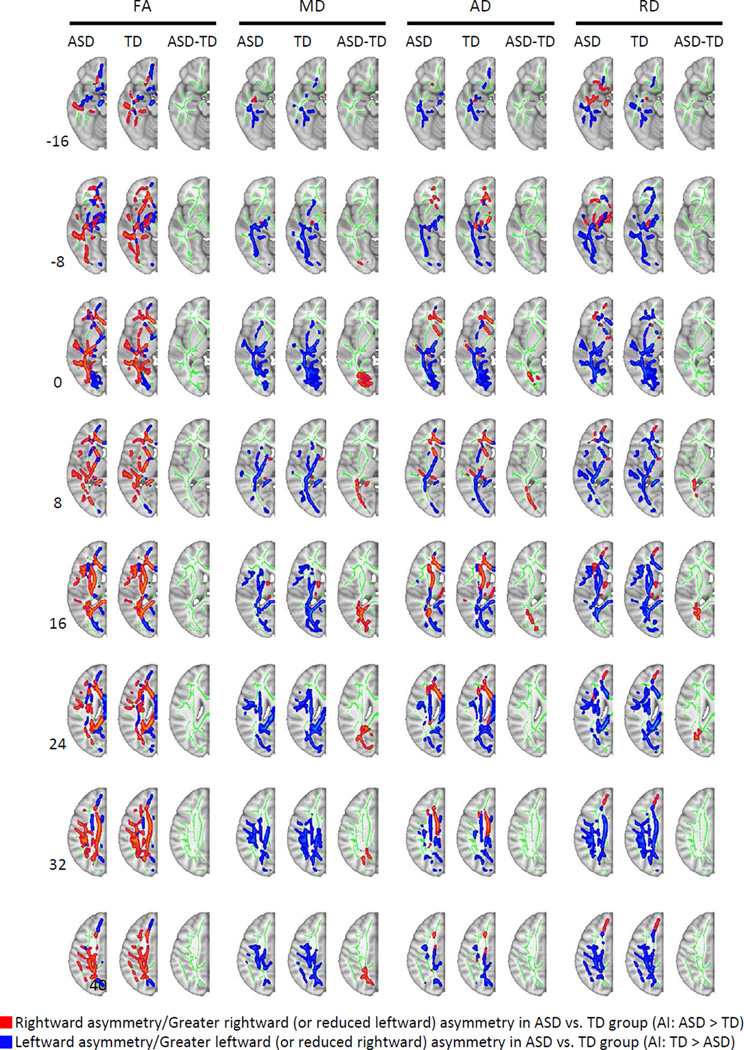
Figure 2.
Within- and between-group significance maps of white matter asymmetry. Note: Effects are presented on a single hemisphere of the symmetric tract-based spatial statistics (TBSS) skeleton (depicted in green). Within-group maps show significant rightward asymmetry (right [R]>left [L]) in red and leftward (L>R) in blue. Between-group maps indicate higher asymmetry indices (autism spectrum disorder [ASD]>typically developing [TD]) in red and lower indices (ASD<TD) in blue. Slice levels are indicated on the left. All effects p < .05 (corr.). AD = axial diffusivity; FA = fractional anisotropy; MD = mean diffusivity; RD = radial diffusivity.

