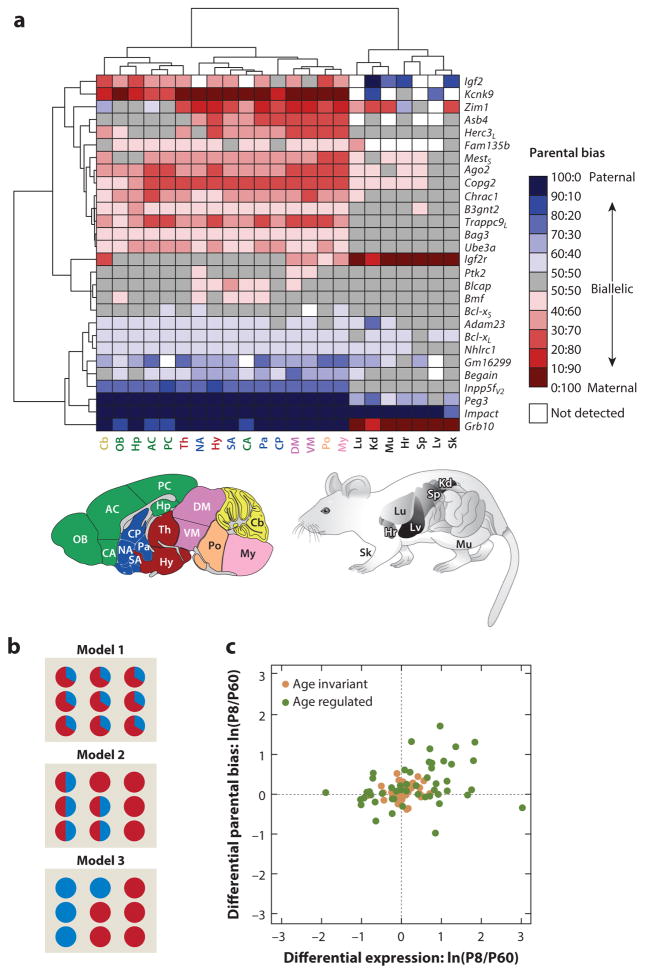
Figure 5.
Regulation of parentally biased imprinted genes in mouse. (a) Spatial regulation of imprinting represented by a hierarchically clustered heat map of the deviation from biallelic gene expression. Panel adapted from Perez et al. (2015). L and S subscripts in the gene names indicate long and short isoforms, respectively, and V2 indicates variant 2 splice form. Acronyms of brain regions (color coded according to their broad developmental relatedness): AC, anterior cortex; CA, cortical amygdala; Cb, cerebellum; CP, caudate putamen; DM, dorsal midbrain; Hp, hippocampus; Hy, hypothalamus; My, medulla; NA, nucleus accumbens; OB, olfactory bulb; Pa, pallidum; PC, posterior cortex; Po, pons; SA, striatum-like amygdala; Th, thalamus; VM, ventral midbrain. Acronyms of nonbrain tissues: Hr, heart; Kd, kidney; Lu, lung; Lv, liver; Mu, muscle; Sk, skin; Sp, spleen. (b) Models providing the single cell–level bases for the parental biases observed in tissue homogenates. Each circle represents a single cell within the homogenized tissue. Red represents maternal expression, and blue represents paternal expression. In model 1, parental biases are identically present in each individual cell. In model 2, parental biases result from a mixture of cells exhibiting monoallelic expression with cells exhibiting biallelic expression. In model 3, parental biases result from a mixture of cells that monoallelically express either the maternal or paternal allele. (c) Age fold change {developing (P8) and adult (P60) cerebella [ln(P8/P60)]} in the magnitude of parental biases versus their age fold change in overall expression level. Panel adapted from Perez et al. (2015). Most genes exhibiting significant age-dependent changes in parental biases also show significant changes in overall expression, with the largest effects for both categories observed during development (Pearson correlation coefficient = 0.33; P = 4 × 10⁻⁴). Age-regulated imprinted genes are represented by green circles (those located near the origin show weak yet statistically significant age effects), and age-invariant imprinted genes are represented by brown circles.

