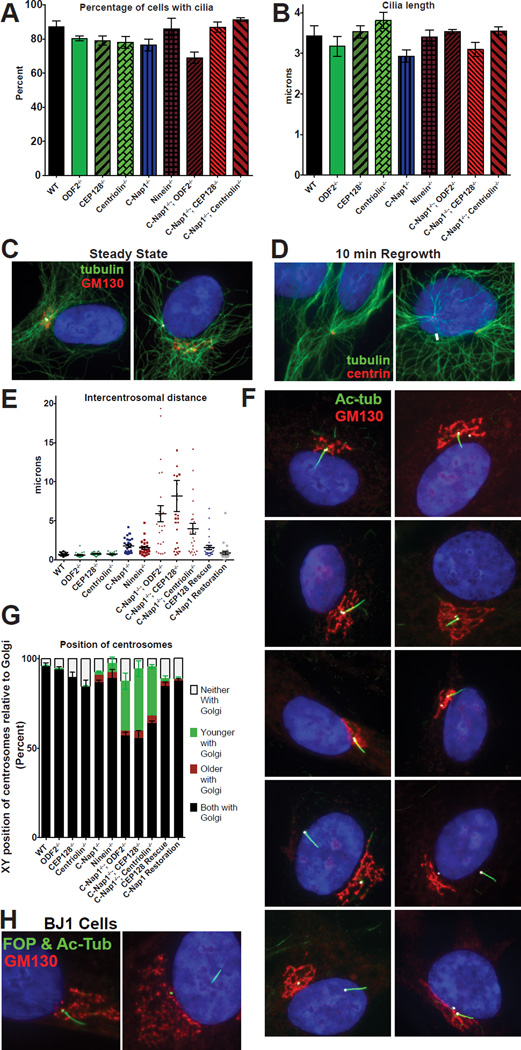
Figure 3. C-Nap1 and sDAP depletion do not affect cilia formation or MTOC activity but disrupts centrosome cohesion and Golgi-cilia association.
(A) The percentage of cells with cilia for each genotype is depicted. RPE1 cells were serum starved for 48 hours prior to fixation and staining with anti-acetylated tubulin antibodies. Bars represent average of three experiments (n>100 cells each) and error bars represent the standard deviation of the three experiments.
(B) Cilia length for each genotype. Bars represent average cilia length between three experiments (n>50 cilia each) and error bars represent the standard deviation.
(C) Microtubule arrays in wild type and C-Nap1−/−; CEP128−/− double KO cells. White arrows point at the location of the centrosomes.
(D) After microtubule regrowth, microtubule arrays (green) are focused on the two centrosomes in both wild type and C-Nap1−/−; CEP128−/− double KO cells. White arrows point to the location of the centrosomes.
(E) The intercentrosomal distances for 25 cells of each genotype are shown. Error bars represent the standard error of the mean. RPE1 cells were serum starved and stained with anti gamma-tubulin antibodies to mark centrosomes for quantification.
(F) Cilia position in RPE1 cells of each genotype indicated is shown with acetylatedtubulin (green), GM130 (red), Cep135 (white) and DAPI (blue).
(G) Quantification of centrosome positions in the X-Y axis relative to the Golgi in each RPE1 lines. The relative position in the Z-axis is ignored. RPE1 cells were serum starved for 24 hours, and stained with markers against the centrosomes, the Golgi and distal appendage (as a marker of the older centrosome). >100 cells in each of three experiments were classified. Bars represent average of the three experiments and error bars represent the standard deviation of the three.
(H) Wild-type or mutant BJ1 cells knocked out of CEP128 and C-Nap1 by CRISPR were stained with indicated antibodies. Note that wild-type BJ1 cells proliferate poorly from a single cell, and thus could not survive the clonal selection process. C-Nap1−/−; CEP128−/− BJ1 cells were examined in the mixed population 6 days after CRISPR treatment. FOP (green) marks the centrosomes, acetylated tubulin (also green) marks the cilia, GM130 (red) marks the Golgi.
See also Figure S2.

