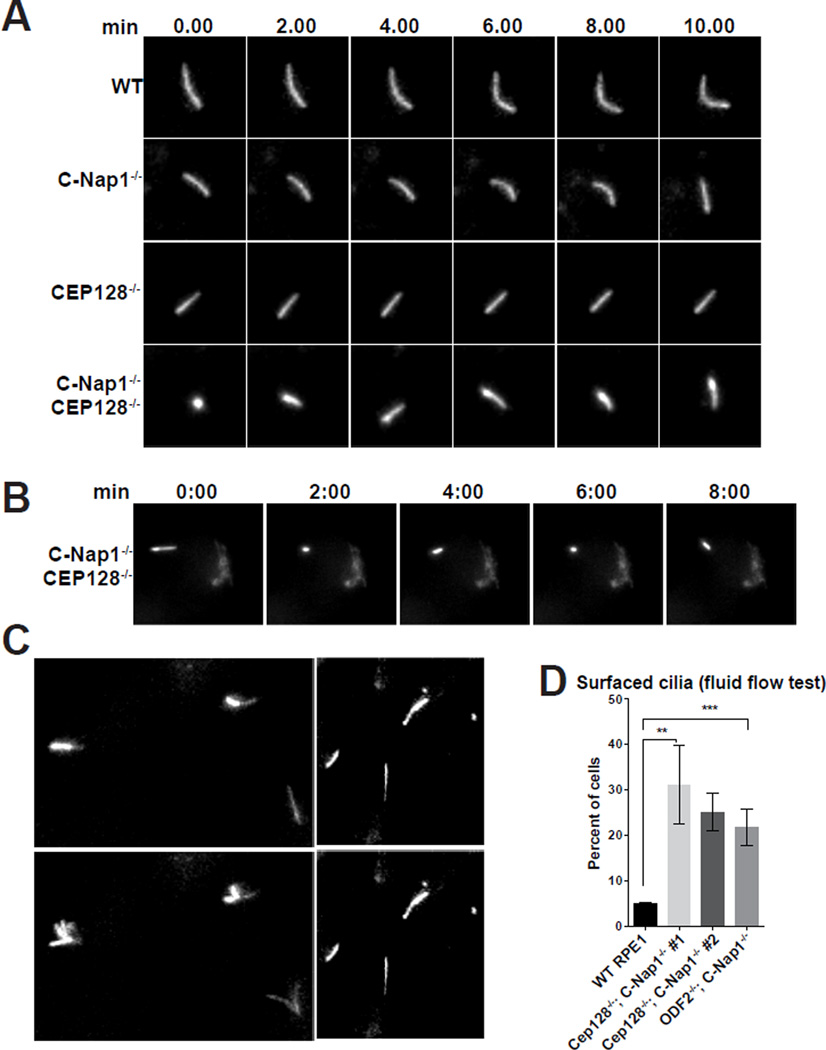
Figure 4. Cilia mobility and position are altered upon depletion of sDAP and C-Nap1.
(A) Still images extracted from long time-lapse movies of indicated RPE1 cell lines expressing Arl13b-GFP. Row labels indicate genotypes of the imaged cells. Column labels indicate the time intervals (in minutes). Each row represents time lapse. The movie for WT or C-Nap1−/−; CEP128−/− mutant cells was provided (see Movie S1 and S2).
(B) Still frames from long time-lapse movies of C-Nap1−/−; CEP128−/− double knockout cell lines expressing both Arl13b-GFP and GalT-GFP, a Golgi marker (see Movie S3). Note that cilia showed wide-range motion while detach from the Golgi.
(C) Fluid was pumped over the cultured cells during the time lapse imaging of Arl13-GFP expressing RPE1 cells. Frames from a short time-lapse movie (10 seconds) are shown. Genotypes of the imaged cells are indicated. Images taken before and during fluid flow are shown. Note that cilia fluttered upon flow activation (see Movie S4 and S5).
(D) The percentage of cilia that respond to fluid flow in WT or indicated mutant cell lines. The average of 3–4 independent experiments is shown. Two independently derived clones of C-Nap1−/−; CEP128−/− mutant cells (#1 & #2) were analyzed. 100–150 cells were scored to determine percentage in each of 3–4 separate experiments. Error bars represent the standard deviations. Significance determined by unpaired two-tailed t-test with Welch’s correction (p<0.01** p<0.001***).

