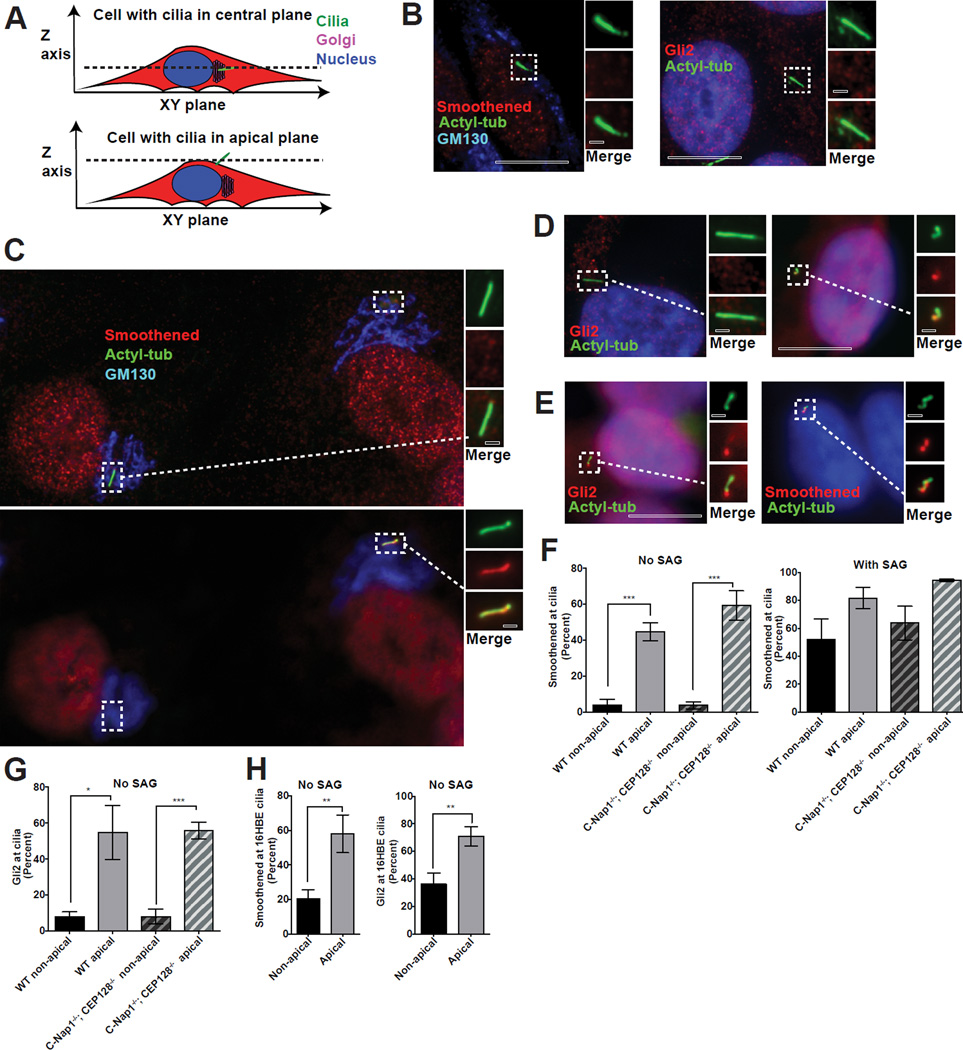
Figure 7. Apically surfaced cilia can ectopically recruit Smoothened and Gli2 in the absence of agonist.
(A) Cartoon depicting submerged or apically surfaced cilia in fixed RPE1 cells guided by the relative position between the cilia, Golgi, and nucleus. Only the cilia positioned at an apical focal plane not overlapping with the Golgi or nucleus were considered “apically surfaced”. Cilia at the same focal plane with the Golgi and nucleus were considered submerged. Wild-type RPE1 cilia are mostly submerged, with only 1–2% surfaced apically. In contrast, apical cilia can be easily found in CEP128−/−; C-Nap1−/− double knockout cells.
(B) Wild-type RPE1 cilia are devoid of Smoothened (left) and Gli2 (right) in the absence of SAG.
(C) Two CEP128−/−; C-Nap1−/− mutant cells in the same field, one carrying apically surfaced cilia (right) and the other submerged cilia (left), were stained with Smoothened, cilia, and Golgi antibodies as indicated. At the central focal plane (top panel), submerged cilia, the Golgi and nucleus were in focus. At the apical focal plane, only surfaced cilia was in focus (bottom panel, right).
(D) CEP128−/−; C-Nap1−/− mutant cells carrying either submerged (left) or apically surfaced (right) cilia were stained with Gli2 antibodies.
(E) Rare wild-type RPE1 cells carrying apically surfaced cilia were stained with Smoothened or Gli2 antibodies as indicated.
(F) Quantification of the ciliary accumulation of Smoothened for each indicated genotype and cilia position in the presence or absence of SAG. Mean and standard deviation are depicted as bars and error bars respectively. 30–60 cilia were scored for each of the three repeats, except for the rare surfaced cilia in wild type cells, which were 10 cilia per repeat. Significance determined by unpaired two-tailed t-test with Welch’s correction (p<0.001 corresponds to ***).
(G) Quantification of the ciliary accumulation of Gli2 for each indicated genotype and cilia position in the absence of SAG. Mean and standard deviation are depicted. 30–60 cilia were scored for each of the three repeats, except for the rare surfaced cilia in wild type cells, which were 10 cilia per repeat. Significance determined by unpaired two-tailed t-test with Welch’s correction (p<0.05 for *) (p<0.001 for ***).
(H) Plot depicting the percentage of 16HBE cells with Smoothened or Gli2 accumulation in cilia for each cilia position. 20–40 cilia were scored for each of three repeats. Mean percentage of the 3 experiments is shown. Error bars correspond to standard deviation. Significance determined by unpaired two-tailed t-test with Welch’s correction (p<0.01**). See also Figure S4.

