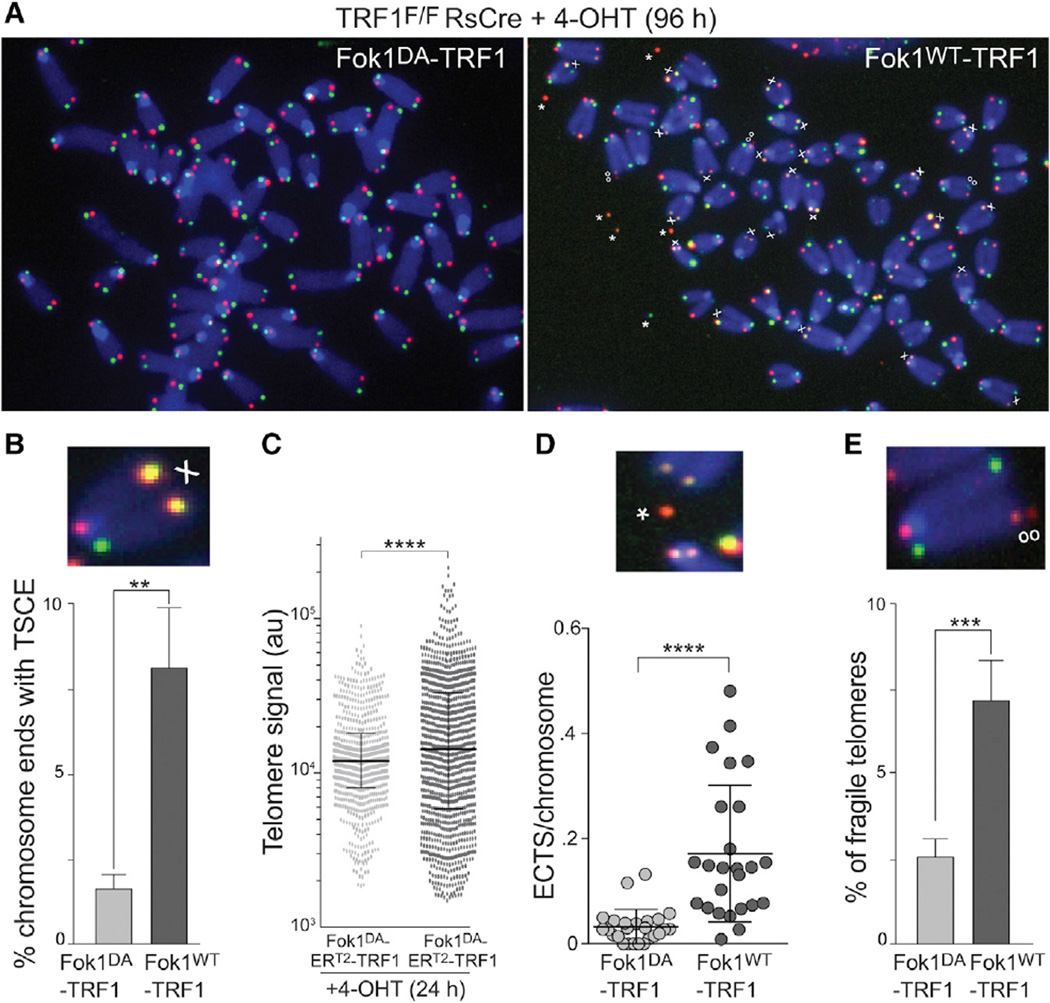
Figure 3. Telomere-Internal DSBs Are Processed by HR.
(A) CO-FISH on metaphase spreads with and without FokI induced DSBs. The experimental procedure is as in Figure 1B. The leading strand telomeres were labeled by PNA-FISH with a Cy3-[TTAGGG]3 probe (red) and lagging strand telomeres with a FITC-[CCCTAA]3 probe (green). The examples from FokIWT-TRF1 or FokIDA-TRF1 expressing cells are shown. X, T-SCEs; oo, fragile telomeres; *, ECTS.
(B) Quantification of chromosome ends with T-SCEs detected by CO-FISH. The bars represent mean with SD from five independent experiments, analogous to the one described in Figure 1B, except that the endogenous TRF1 was not deleted. p value from two-tailed paired t test.
(C) Telomere length heterogeneity measured using quantitative FISH analysis on metaphase spreads. FokI-ERT2-TRF1 constructs were introduced into SV40-LT immortalized MEFs by retroviral infection and selection. The samples were analyzed 24 hr after 4-OHT. The telomere signal intensity was measured as in Figure 2D. The ten metaphases, ~800 telomeres, were analyzed per sample, and the values are reported as a scatter dot plot with bars representing median with interquartile range. p value from F-test of variance.
(D) Quantification of ECTS from the experiment described in (A). There were 25 metaphases per sample that were analyzed. p value from two-tailed unpaired t test.
(E) Quantification of fragile telomeres. The fragile telomeres were scored in four independent experiments as described in (C). The bars represent means with SDs. p value from two-tailed paired t test.

