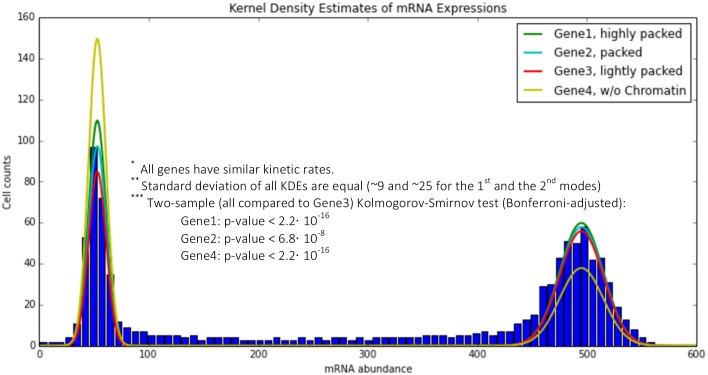
Fig 3. Effect of the chromatin structure on the gene expression pattern.
Not only does the chromatin structure reduce the diffusion rate due to the macromolecular crowding effect, it also can determine the transcription pattern of different genes due to their location. Each distribution is compared to gene 3 (red curve) using Kolmogorov-Smirnov test (Bonferroni-adjusted for multiple comparisons). p-values show significant difference between distributions (each distribution is obtained by 16000 data points). Histograms show the total number of the cells with certain Gene2 expression levels, indicating the intermediate states for this gene.

