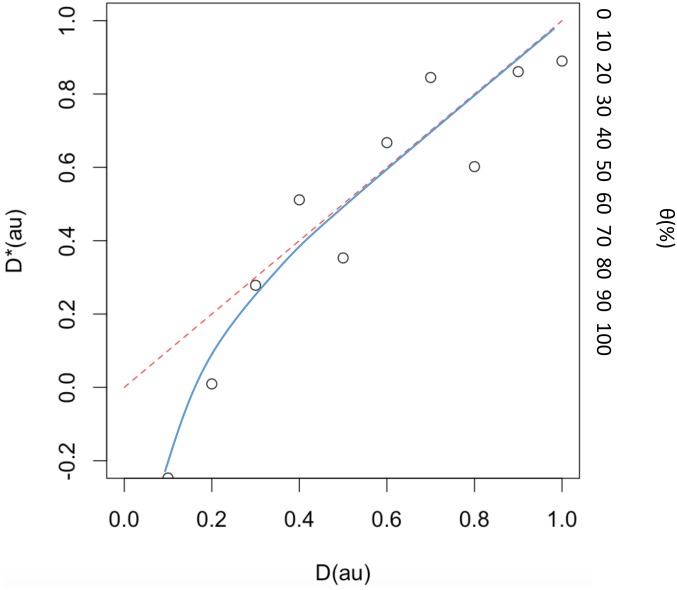
Fig 4. Impact of the diffusion-limited gene expression on the cell population diversity (D* is the effective diffusion coefficient).
The red dotted line shows the hypothetical line that explains the variability in a cell population completely as a result of diffusion-limited gene expression. The blue line is a logarithmic fit to our simulation results and supports the hypothesis of robust gene expression as a result of diffusion-limited gene expression (a large crowding agent was used).

