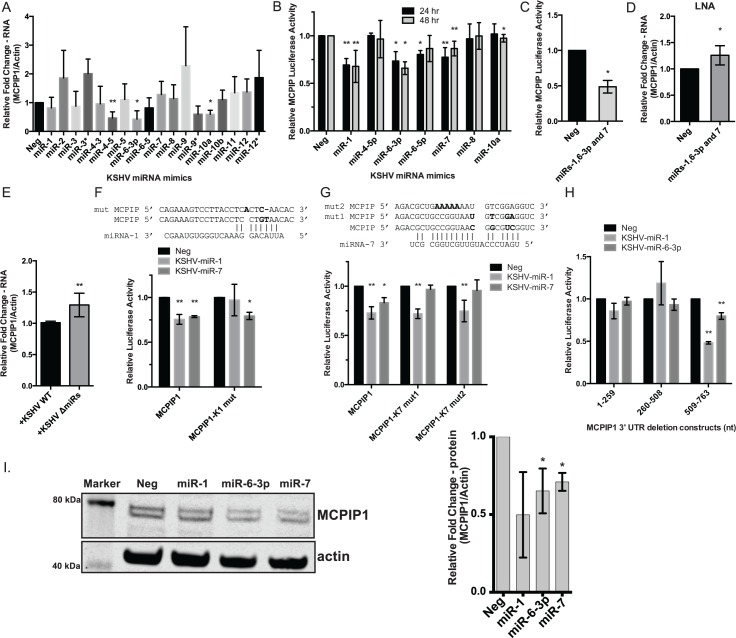
Fig 4. KSHV miRNAs target the MCPIP1 3’ UTR.
(A) MCPIP1 RNA expression was determined using qPCR from HUVECs transfected with individual KSHV miRNA mimics. Results are shown relative to β-actin and normalized to the negative control, N = 2–7. (B) 293 cells were transfected with individual KSHV miRNAs and a MCPIP1 3’ UTR reporter plasmid. Lysates were analyzed 24 or 48 hpt, and relative MCPIP1 luciferase activity is expressed as a ratio to an internal luciferase control and normalized to an empty reporter vector and the negative control miRNA, N = 3–9. (C) 293 cells were transfected with a combination of KSHV miRNA mimics, KSHV-miR-1, 6-3p and 7 as in B, N = 3. (D) BCBL-1 cells were nucleofected with LNAs for KSHV-miR-1, 6-3p and 7. RNA was isolated 24 hpt and MCPIP1 expression was measured using qPCR. N = 4. (E) MCPIP1 expression was measured using qPCR as in (A) from iSLK cells containing a WT KSHV genome and a mutant containing a KSHV miRNA cluster deletion. Results are shown relative to β-actin and normalized to the WT KSHV infected iSLK cells, N = 6. (F) The sequence of the KSHV-miR-1 binding site (mutations in bold) in the MCPIP1 3’UTR and luciferase reporter assays containing a mutated binding site for KSHV miR-1. N = 3–4. (G) The sequence of the KSHV-miR-7 binding site (mutations in bold) in the MCPIP1 3’UTR and luciferase reporter assays containing two different mutations for the KSHV miR-7 binding site, N = 4–9. (H) 293 cells were transfected with individual KSHV miRNAs and one of the three MCPIP1 deletion reporter vectors. N = 3. (I) Western blots are shown for HUVECs transfected with a control (Neg) or KSHV miRNA mimics, N = 3. For all graphs, results are shown as mean ± SD of at least three independent biological replicates. Significance was assessed using a Student’s t test, *p ≤ 0.05, **p ≤ 0.01. Numerical data can be found in S1 Data.

