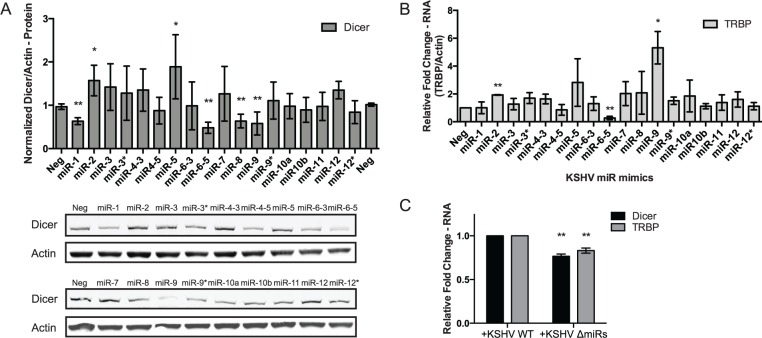
Fig 5. KSHV miRNAs increase expression of miRNA biogenesis components Dicer and TRBP.
(A) Dicer protein expression was determined by western blot from HUVECs transfected with individual KSHV miRNA mimics. The results are averaged from 4–5 replicates and a representative western blot is shown. (B) TARBP2 RNA expression was determined using qPCR from HUVECs transfected with individual KSHV miRNA mimics. Results are shown relative to β-actin and normalized to the negative control. For all graphs, results are shown as mean ± SD, N = 3. Significance was assessed using a Student’s t test, *p ≤ 0.05, **p ≤ 0.01. (C) Dicer and TRBP expression was measured using qPCR as in (B) from iSLK cells containing a WT KSHV genome and a mutant containing a KSHV miRNA cluster deletion. N = 5. For all graphs, results are shown as mean ± SD. Significance was assessed using a Student’s t test, *p ≤ 0.05, **p ≤ 0.01. Numerical data can be found in S1 Data.

