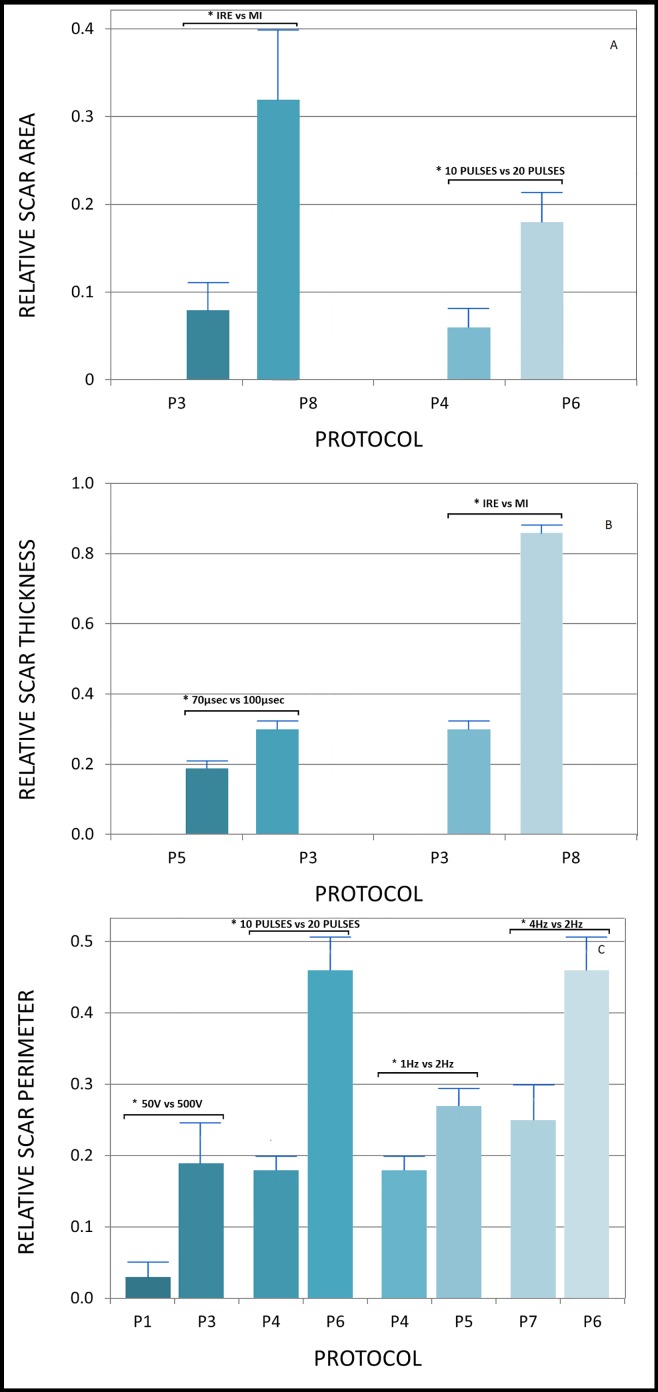
Fig 3. Comparison of morphometric measurements between pairs of protocols.
Morphometric measurements of pairs of protocols with only one changed parameter were compared (using unpaired Student t-test), in order to learn about the effect of different parameters on the potency of each protocol. Only pairs with a statistically significant difference in morphometric measurements are shown. From top to bottom: (3a) presents comparisons of scar areas with significant differences. (3b) presents comparisons of scar thicknesses with significant differences. (3c) presents comparisons of scar perimeters with significant differences.

