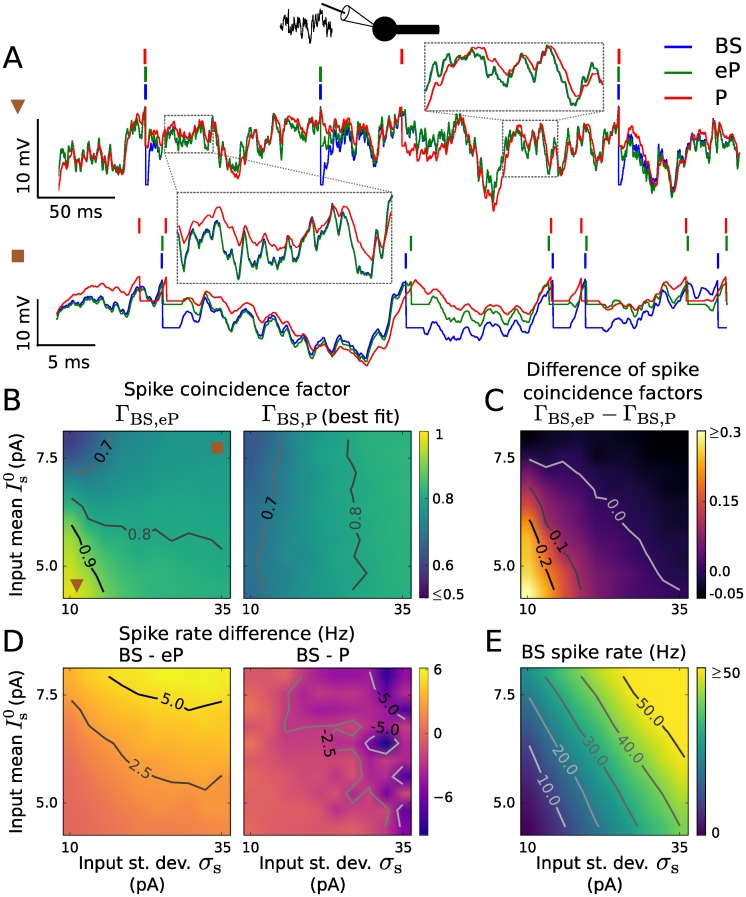
Fig 3. Reproduction of spiking activity for somatic inputs using LIF type models.
A: Membrane voltage traces of the BS (blue), eP (green) and P (red) neuron models in response to a weak ( pA, σs = 11.94 pA, top) and a strong input current ( pA, σs = 33.34 pA, bottom). The parameter values of the P model were tuned independently to maximize the coincidence factor ΓBS,P for each set of input parameters. B: Coincidence factor for the BS and eP model spike trains, ΓBS,eP (left), and for the BS and P model spike trains, ΓBS,P (right) as a function of input mean and standard deviation σs. C: Difference ΓBS,eP − ΓBS,P between the coincidence factors shown in B. D: Spike rate difference of the BS and eP models (left) and of the BS and P models (right) as a function of and σs. E: Spike rate of the BS neuron model. The input parameters used in A are indicated in B. Results presented in B-E are averages over 6 noise realizations. The parameter values of the BS model are listed in Table 1.

