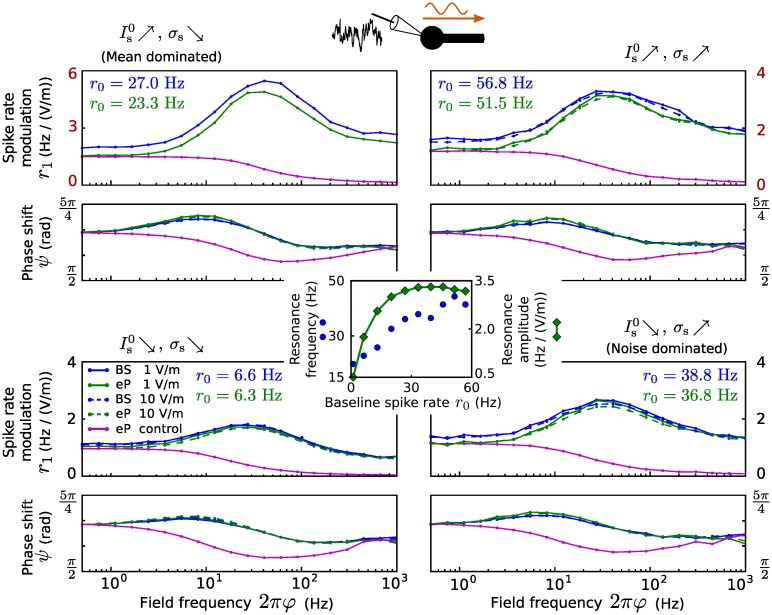
Fig 6. Spike rate modulation due to an electric field for somatic inputs.
Top/bottom, left/right: Spike rate modulation of the BS (blue) and the eP (green) models due to an oscillating electric field as a function of its frequency, for different field amplitudes (E1 = 1 V/m, solid lines; E1 = 10 V/m, dashed lines) and somatic inputs: pA, σs = 11.94 pA (top left), pA, σs = 33.34 pA (top right), pA, σs = 11.94 pA (bottom left), and pA, σs = 33.34 pA (bottom right). Magenta lines show the spike rate modulation of the eP model for which IE was given by IE(t) = I1 sin(φt + ϕ) with constant amplitude I1 = |B(0.5/(2π))|, phase shift ϕ = arg(B(0.5/(2π))), B from Eq 21 and E1 = 10 V/m. Note the different amplitude scales in the top panel. Results for larger field amplitude (E1 = 10 V/m) are not displayed for the mean driven regime (top right), because spike rate modulation amplitudes exceeded the baseline rate in that case, which impedes the modulation quantification procedure (see Methods). Center: Resonance frequency argmax(r1) and amplitude max(r1) of the spike rate modulation of the eP model as a function of baseline spike rate r0, which was changed by simultaneously increasing (, σs) from (4.25 pA, 8.89 pA) to (8.12 pA, 36.40 pA).

