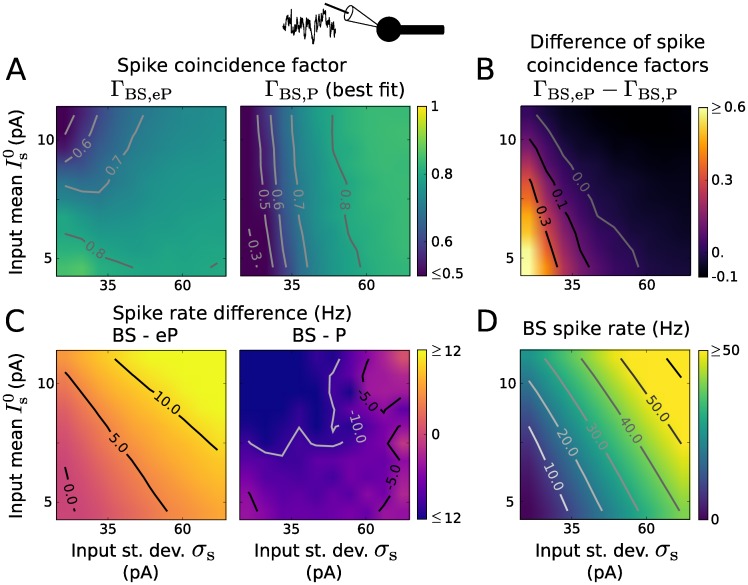
Fig 8. Reproduction of spiking activity for somatic inputs using EIF type models.
A: Coincidence factor for the BS and eP model spike trains, ΓBS,eP (left), and for the BS and P model spike trains, ΓBS,P (right) as a function of input mean and standard deviation σs. The parameter values of the P model were optimized to maximize ΓBS,P for each input (i.e., (, σs)-pair) independently. B: Difference ΓBS,eP − ΓBS,P between the coincidence factors shown in B. C: Spike rate difference of the BS and eP models (left) and of the BS and P models (right) as a function of and σs. D: Spike rate of the BS neuron model. Results presented in A-D are averages over 6 noise realizations. The parameter values of the BS model are listed in Table 1.

