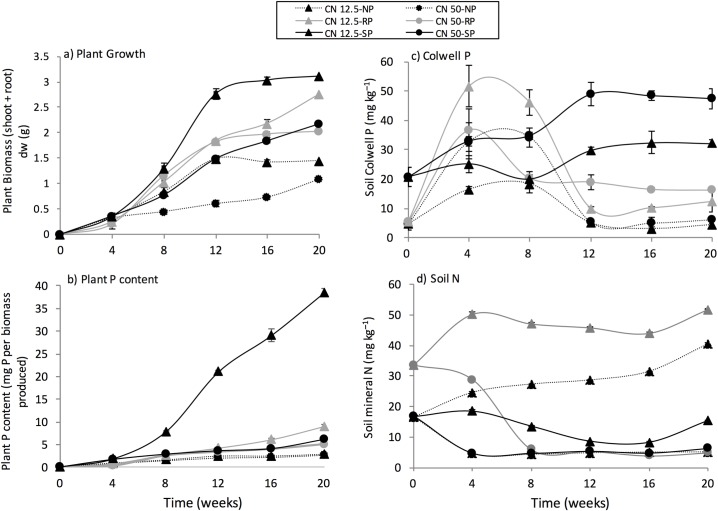
Fig 1.
The effect of P treatment and C:N ratio applied on (a) plant growth, (b) plant P content, (c) soil Colwell P, and (d) soil mineral N. Dashed lines represent no P, grey lines represent rock P and solid lines represent solution P amendment—triangles represent the application of a C:N ratio of 12.5:1 and circles represent the application of a C:N ratio of 50:1. Standard error of means is shown (n = 3).

