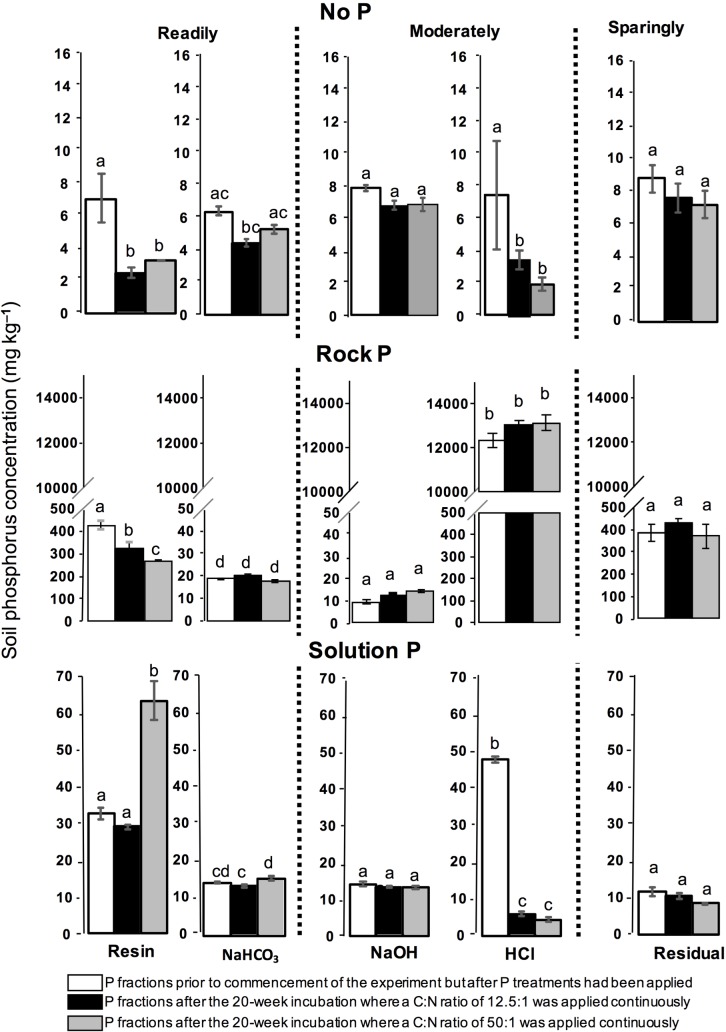
Fig 2. Change in soil P forms over the course of the experiment.
(1) white bars represent P fractions prior to commencement of the experiment but after P treatments had been applied (2) black bars represent P fractions after the 20-week incubation where a C:N ratio of 12.5:1 was applied continuously and (3) grey bars represent P fractions after the 20-week incubation where a C:N ratio of 50:1 was applied continuously. Soil P forms were further grouped based on perceived plant P availability (readily-available P, moderately-available P and sparingly-available P). Standard error of means are shown (n = 3). Significant differences (P < 0.05) are indicated by different lowercase letters while those not statistically significant (P > 0.05) are indicated by the same lowercase letters. Different superscript letters indicate significant difference (P<0.05) in P fractions after 20 weeks following the two C:N treatments compared to initial levels as assessed by ANOVA followed by Fisher’s least significant difference (LSD).

