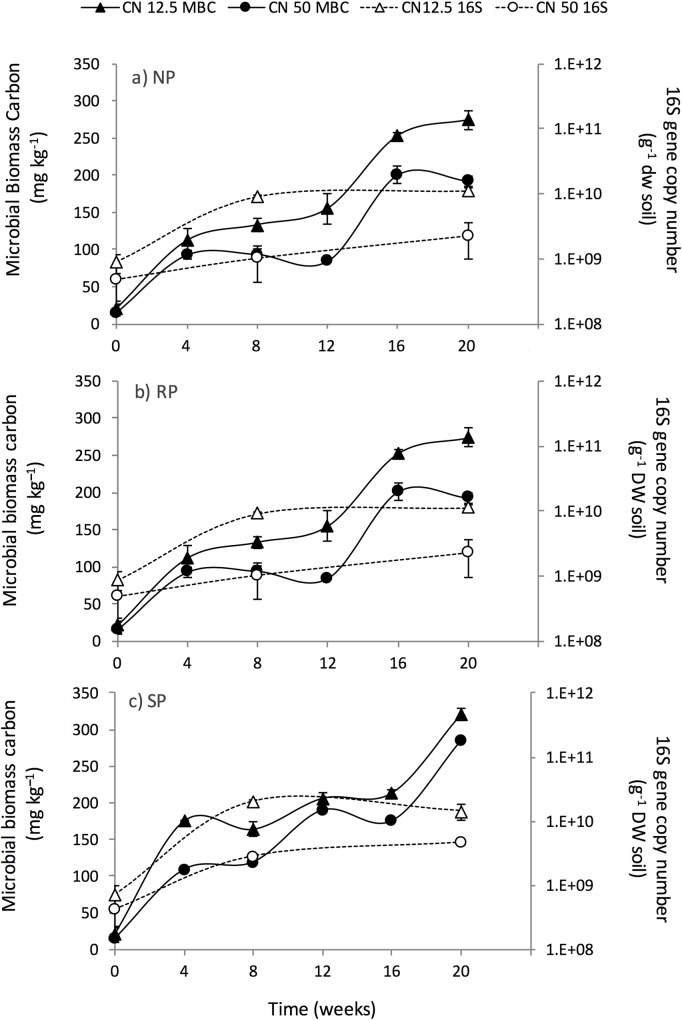
Fig 3.
Change in MB-C (solid lines) and 16S gene abundance (dashed lines) with (a) no P treatment (b) rock P treatment (c) solution P treatment. Closed triangles represent MB-C where an artificial root exudate with a C:N ratio of 12.5:1 was applied; closed circles represent MB-C where an artificial root exudate C:N ratio of 50:1 was applied. Open triangles represent bacterial 16S gene abundance where an artificial root exudate C:N ratio of 12.5:1 was applied and open circles represent bacterial 16S gene abundance where an artificial root exudate C:N ratio of 50:1 was applied.

