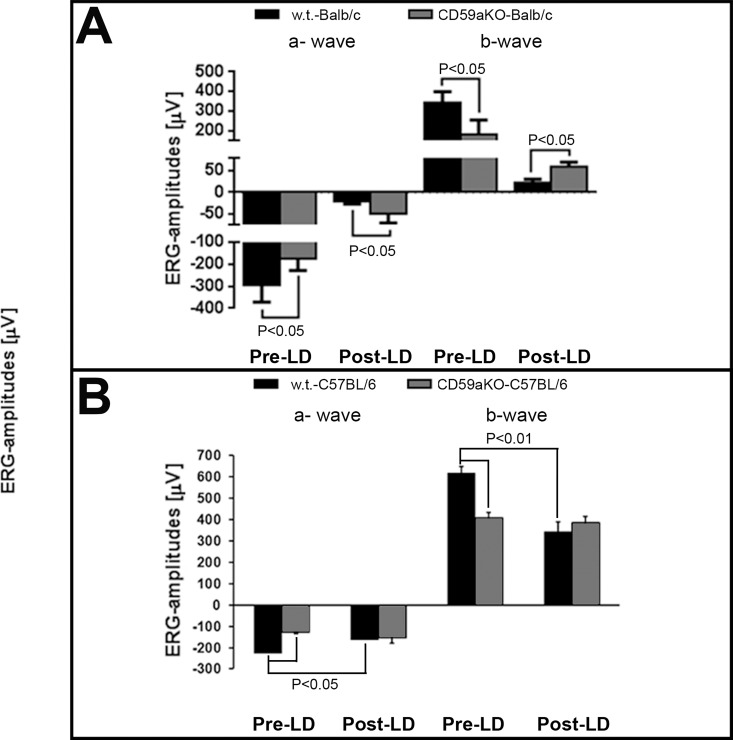
Fig 3. ERG responses before and after LD.
Before LD, rod-a (P<0.05) and rod-b (P<0.05) waves were decreased in CD59aKO Balb/c mice compared to WT (A). At day 7 after LD, however, rod-a (P = 0.04) and rod-b (P = 0.01) waves were all larger in CD59aKO compared to WT (A). Data are expressed as means ± SD. N = 4. Similarly, rod-a (P<0.05) and rod-b (P<0.01) wave amplitudes were smaller in CD59aKO C57BL/6J mice compared to C57BL/6J mice at baseline, and while C57BL/6J mice have diminished ERG amplitudes 10 days after LD, amplitudes in CD59aKO mice remain unchanged (B). Data are expressed as means ± SD. N = 6–7.

