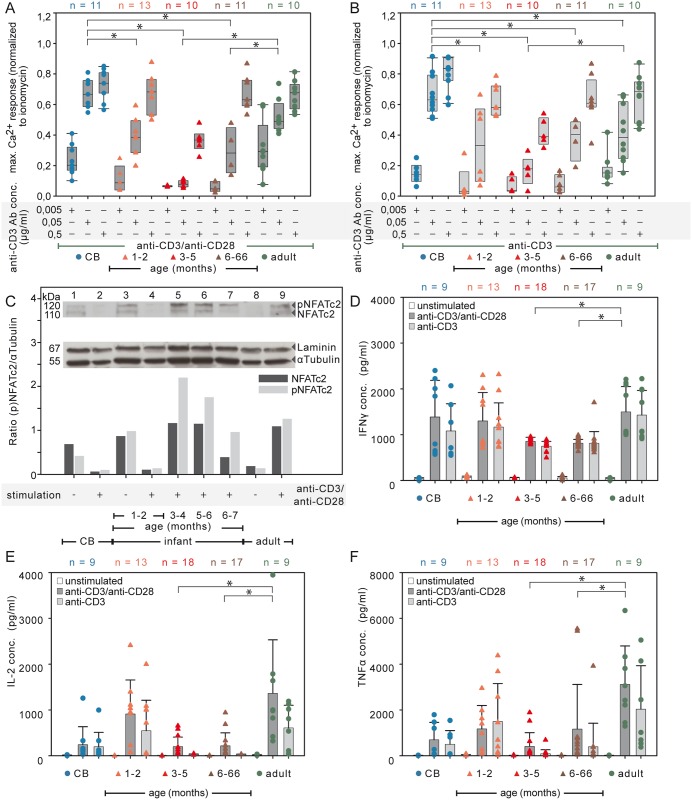
Fig 6. Age-dependent signatory Ca2+ influx and cytokine concentrations in supernatants of naive CD4+ T cells.
(A-B) CD4+CD45RA+CD31+ T cells stimulated with anti-CD3 Ab as indicated either with costimulation by 0.5 μg/ml soluble anti-CD28 Ab (A, dark gray) or with the CD28 isotype control (B, light gray). Compiled data of box plots with scatter plots represent the Ca2+ influx response normalized to the maximal Ca2+ influx ionomycin response. Statistical significance between groups was determined by two tailed ANOVA Tukey-Kramer post-hoc test * P<0.05. n = number of individuals. (C) NFATc2 expression after anti-CD3 Ab plus anti-CD28 Ab engagement. The densitometric analyses of the immunoblots for the relative protein expression levels are shown as ratios of NFATc2 or pNFATc2 to αTubulin. Lysates from three different donors were pooled. Results are representative of at least two independent experiments. IFNγ (D), IL-2 (E), and TNFα (F) concentrations in the supernatants of unstimulated (white), of soluble anti-CD3 Ab plus anti-CD28 Ab stimulated (dark gray), and of TCR/CD3 stimulated alone (light gray, with anti-CD28 Ab isotype) of naive T cells using a Bio-Plex cytokine assay (Bio-Rad). The mean value and SD are indicated for five independent experiments (two tailed ANOVA Tukey-Kramer post-hoc test * P<0.05). n = number of individuals.

