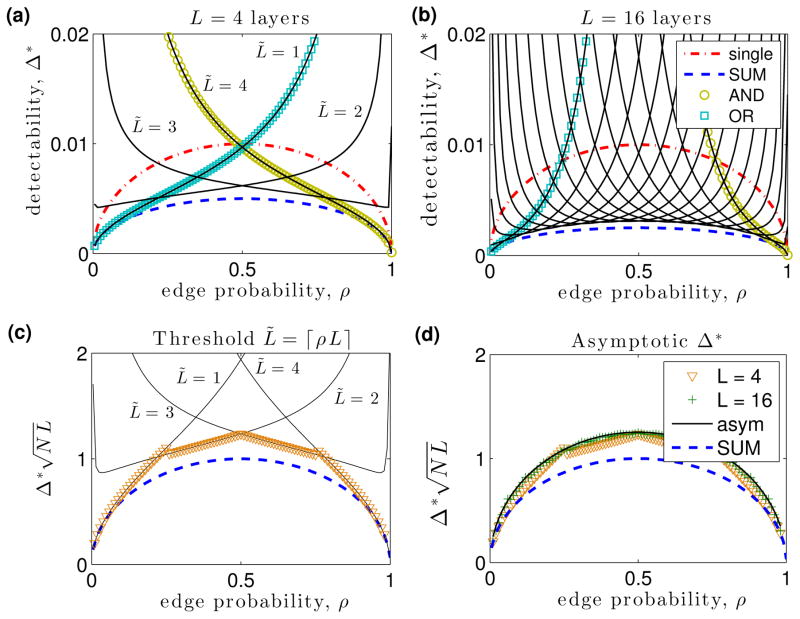
FIG. 1. (Color online) Layer aggregation enhances the detectability of community structure.
(a)–(b) We plot the detectability limit Δ* versus mean edge probability ρ for a single network layer (red dot-dashed curves), the aggregate network obtained by summation (blue dashed curves), and aggregate networks obtained by thresholding this summation at L̃ ∈ {1, 2, 3, 4} (solid curves). Gold circles and cyan squares highlight L̃ = L and L̃ = 1, which we refer to as AND and OR networks, respectively. Results are shown for N = 104 nodes with (a) L = 4 and (b) L = 16 layers. (c) For L = 4, we show Δ* versus ρ for the optimal threshold L̃ = ⌈ρL⌉ (orange triangles), which lies on the solution curves for L̃ ∈ {1, …, L} (solid curves). (d) We show Δ* for L̃ = ⌈ρL⌉ with L ∈ {4, 16}. These piecewise-continuous solutions collapse onto the asymptotic solution (black curve) as L increases. In panels (c)–(d), we additionally plot Δ* for the summation network (blue dashed curves).

