FIG. 6.

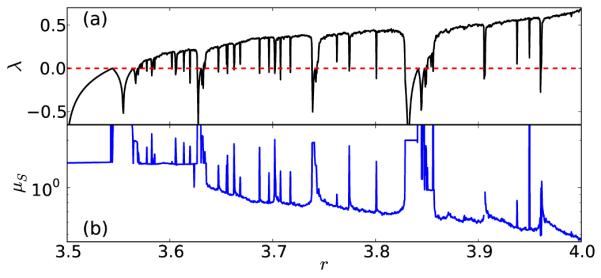
(Color online) Correspondence between μS (blue line in (b)) and the Lyapunov exponent λ (black line in (a)) for the logistic map. The parameters used for this figure are the same as used for Fig. 2.

(Color online) Correspondence between μS (blue line in (b)) and the Lyapunov exponent λ (black line in (a)) for the logistic map. The parameters used for this figure are the same as used for Fig. 2.