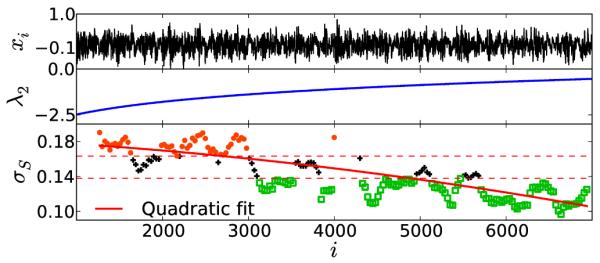
FIG. 7.

(Color online) Identifying drift in the dynamics of the Baker’s map with continuously changing parameter β. As indicated in Eq. (27), λ1 is constant with respect to β. In contrast, λ2 = ln β. We observe σS changing from significantly higher values to significantly lower values as the time progresses. A quadratic fit describes this evolution (red curve), indicating the nonlinear change of parameter of the system.
