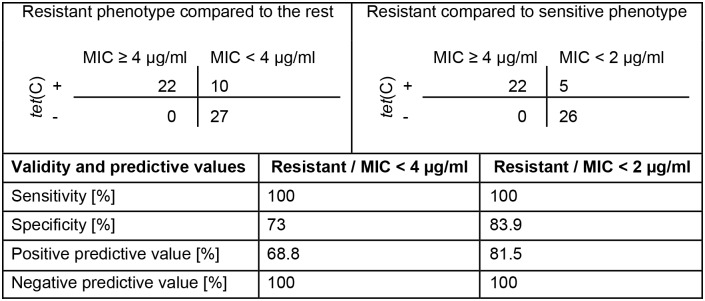
Fig 4. Validity and predictive values of the tet(C) PCR compared to in vitro susceptibility.
Shown are the validity (sensitivity, specificity) and the predictive values of the tet(C) PCR compared to the phenotype by antibiotic susceptibility assay in vitro. The upper left panel and the middle column show the comparison between the resistant phenotype (MIC ≥ 4 μg/ml) and the sensitive or intermediate phenotype (MIC < 4 μg/ml). The upper right panel and the right column compare the resistant with only the sensitive phenotype (MIC < 2 μg/ml).

