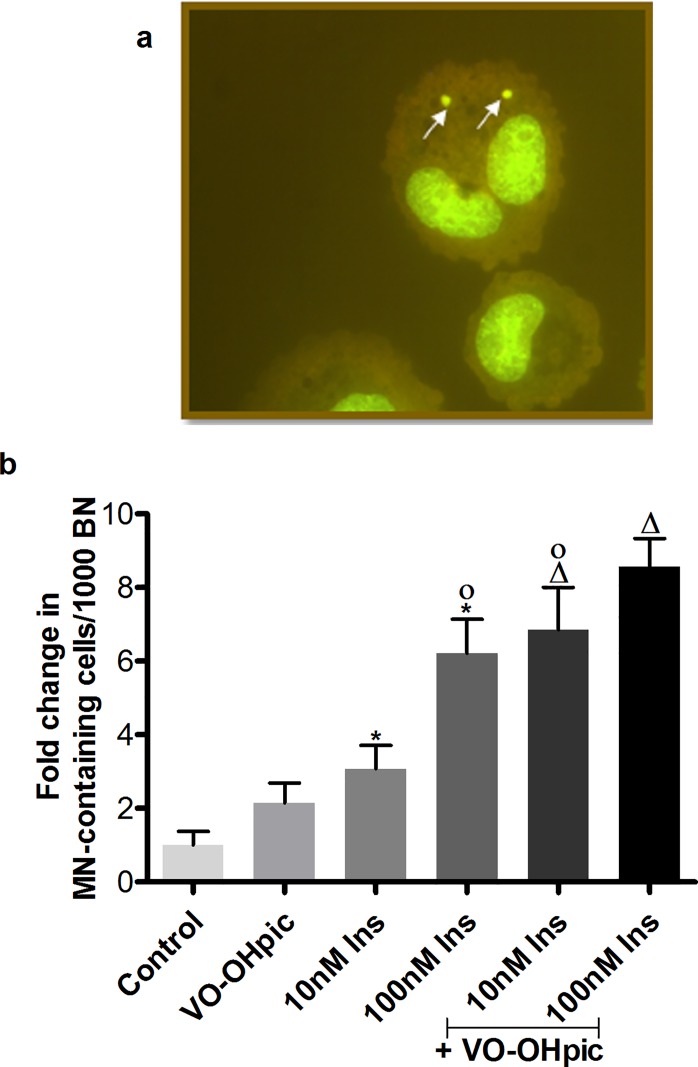
Fig 3. MN induction in IHH cells by insulin treatment with or without PTEN inhibition.
a. Representative picture of micronuclei in a binucleated cell. b. Quantification of micronucleus test. Data are presented as mean fold change of MN-containing cells in 1000 binucleated cells (BN) compared to control ± SEM of 4 independent experiments. * p≤0.05 vs. solvent control, Δ p≤0.05 vs. VO-OHpic, ○ p≤0.05 vs. 10 nM insulin, ● p≤0.05 vs. 100 nM insulin. ▫ p≤0.05 vs. VO-OHpic + 10 nM insulin and ▪ p≤0.05 vs. VO-OHpic + 100 nM insulin.

