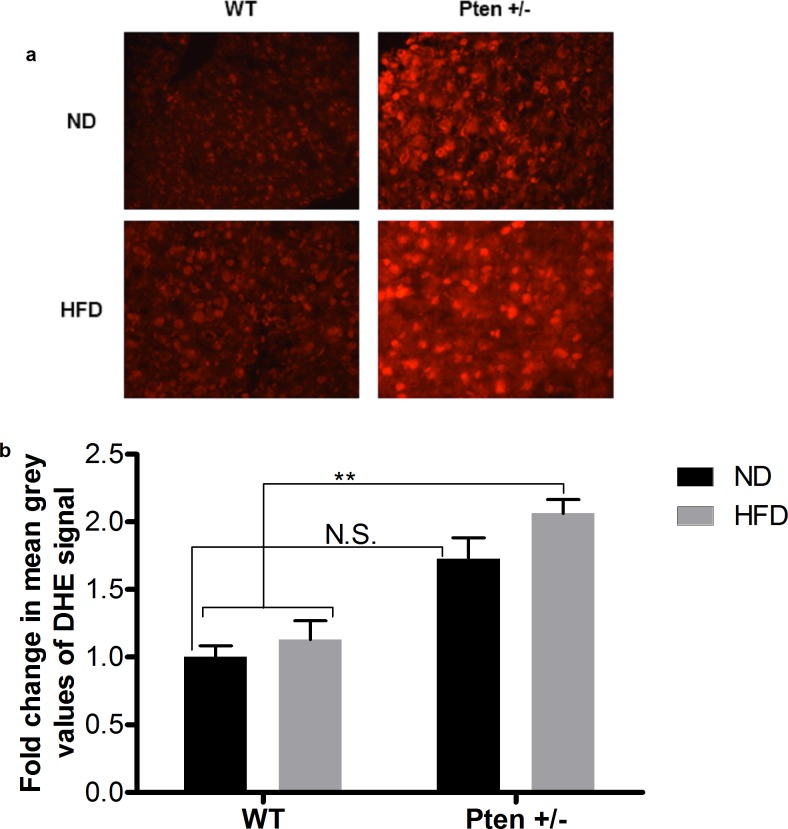
Fig 6. Detection of ROS in mouse liver by DHE staining.
a. Representative pictures from DHE stained liver sections of Pten +/- and WT mice after feeding with ND or HFD. b. Quantification of ROS formation was achieved by measuring mean grey values of DHE signal from 200 cells using image j software. Mice (WT (ND, n = 6; HFD, n = 9), Pten +/- (ND, n = 9; HFD, n = 9)) had been fed with ND or HFD for 20 weeks. Data are presented as mean fold change compared to the WT/ND ± SEM. * p≤0.05 and ** p≤0.01.

