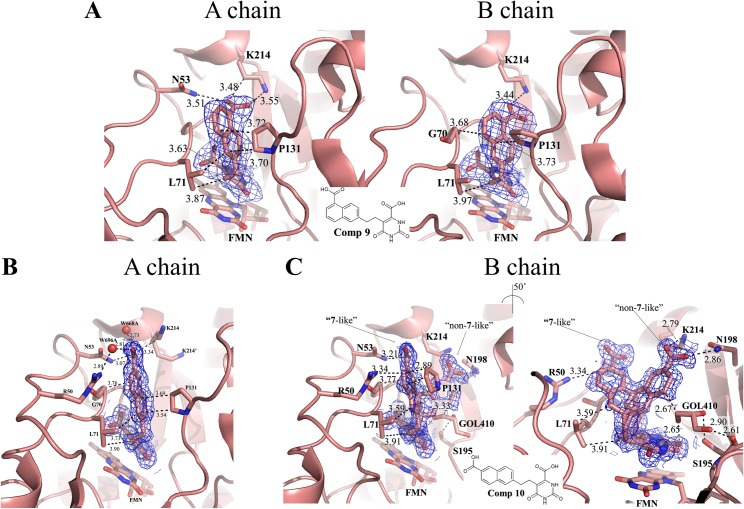
Fig 4. Binding modes of the top 2 TcDHODH inhibitors designed in this study.
(A) Binding mode of 9 to chains A (left) and B (right); (B) Binding mode of 10 to the A chain; (C) Dual binding mode of 10 into the B chain. Left and right panels emphasize the interactions of 5-substituent groups from 7-like and non-7-like binding modes, respectively. Key residues within a 4.0 Å distance to 5-subtituents 9, 10, and FMN are shown as stick. Dashed line represents hydrophobic or hydrogen bond interaction. Atoms of carbon, nitrogen, and oxygen are colored in salmon, blue, and red, respectively. Electron density maps are shown as blue mesh and contoured at a 1 σ level.

