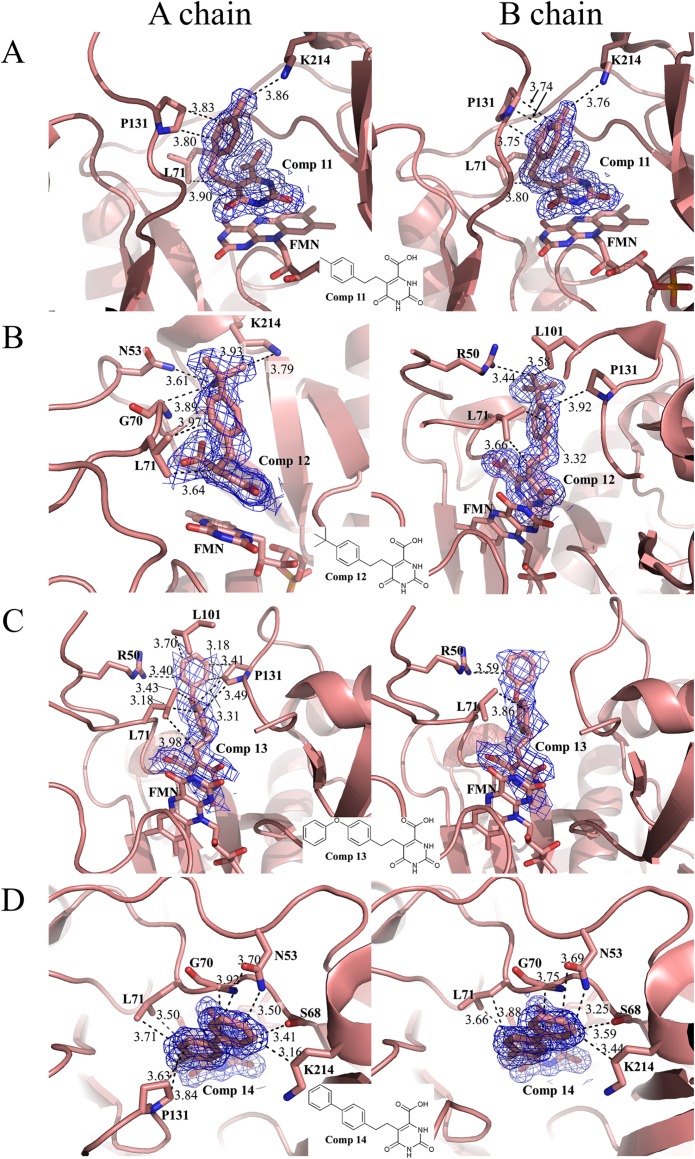
Fig 5.
Binding mode of Comp 11 (A), 12 (B), 13 (C) and 14 (D) into chains A (left) and B (right) of TcDHODH. Key residues within 4.0 Å distance to 5-subtituent groups, inhibitors and FMN are shown as stick. Dashed lines represent hydrophobic or hydrogen bond interactions between 5-substitutent and protein residues within 4.0 Å distance, which are shown as the number next to the respective interactions. Color codes are same as Fig 4. Electron density map of Comp 11–14 are shown as blue mesh and contoured at 1 σ level.

