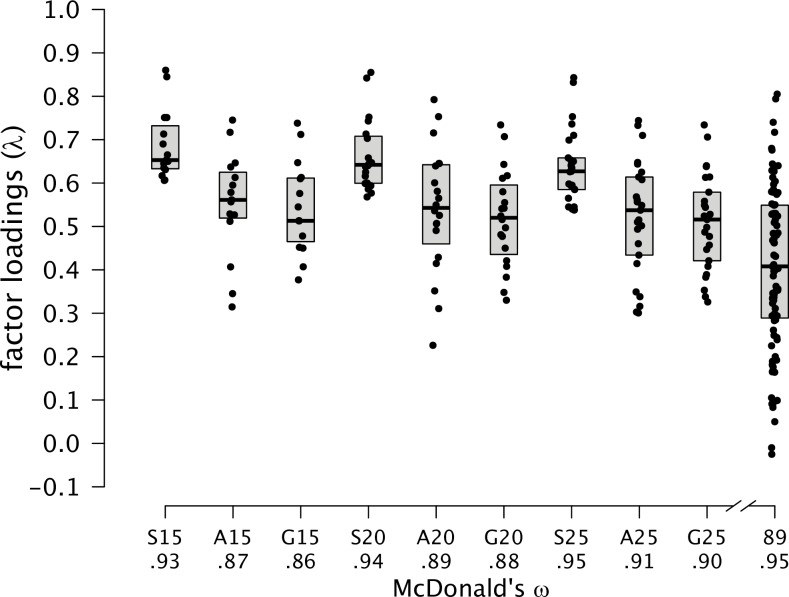
Fig 2. Distribution of Factor Loadings for the Original and Shortened Versions.
A boxplot covers the interquartile range; the solid line refers to the median. Letters indicate the item selection algorithm: S = Stepwise Confirmatory Factor Analysis; A = Ant Colony Optimization; G = Genetic Algorithm; Numbers refer to the number of items in the abridged version; 89 = Original version with 89 items.

