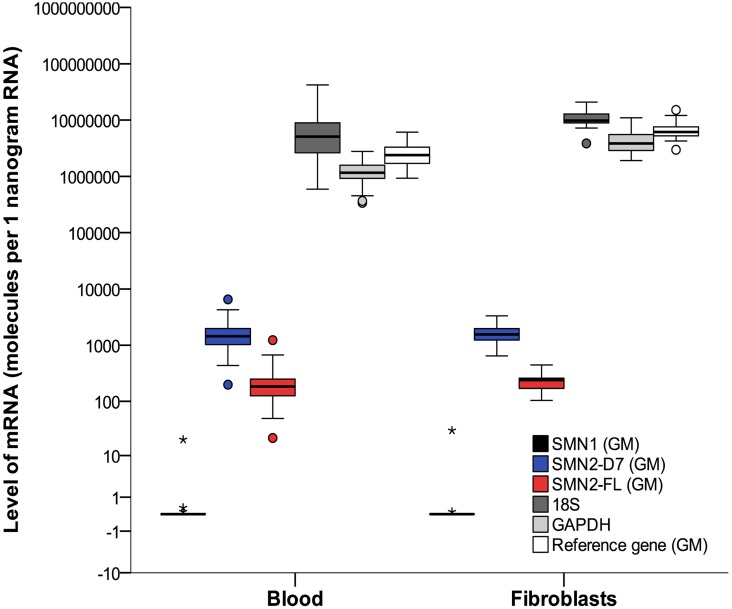
Fig 3. mRNA levels of SMN and reference genes.
Analysis of mRNA was performed in blood and fibroblasts from patients with SMA. Boxplots represent mRNA levels of SMN1, SMN2-FL and SMN2-Δ7 normalized by the geometric mean of the two reference genes (GAPDH and 18S). The reference gene plot (white bar) represents the geometric mean (GM) of GAPDH (light grey bar) and 18S (dark grey bar). For reasons of clarity, individual levels of GAPDH and 18S are presented as well. Levels of SMN2-FL and SMN2-Δ7 did not differ between blood and fibroblasts (p>0.05). One patient had a heterozygote deletion and an additional point mutation of the SMN1 gene, represented by a SMN1-mRNA level of 20 molecules per 1 nanogram of RNA shown by the asterisk (SMN1-levels in 6 controls ranging from 150–350 molecules per 1 nanogram (data not included in this report)). Boxplot elements represent: median (line in the middle), 1st en 3rd quartile (bottom and top of the box), highest case with 1.5 time inter-quartile range (bottom and top whisker) and outliers (dots and asterisks). SMN2-D7 = SMN2-Δ7.

