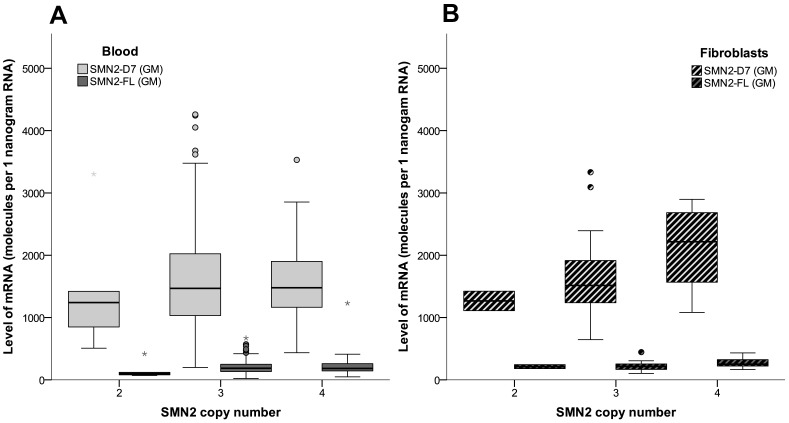
Fig 5. SMN2 mRNA expression levels in blood and fibroblasts from patients with SMA in relation to SMN2 copy number.
Levels of SMN2-FL and SMN2-Δ7 in relation to SMN2 copy number in blood (Panel A; KW SMN2-FL p = 0.7; KW SMN2-Δ7 p = 0.3) and fibroblasts (Panel B; KW SMN2-FL p = 0.3; KW SMN2-Δ7 p = 0.09) from patients with SMA. Data shown are normalized to the geometric mean (= GM) of GAPDH- and 18S-reference genes. Boxplot elements represent: median (line in the middle), 1st en 3rd quartile (bottom and top of the box), highest case with 1.5 time inter-quartile range (bottom and top whisker) and outliers (dots and asterisks). SMN2-D7 = SMN2-Δ7.

