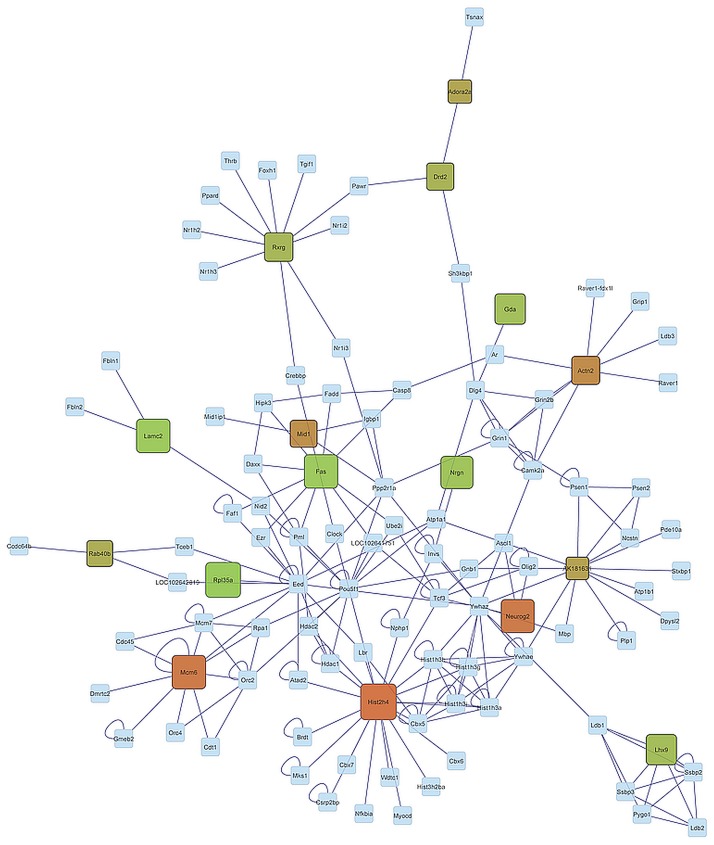
Fig 4. Gene network of genes significantly differentially expressed (FDR-adjusted P-value < 0.05) in the Control genotype-Free activity environment and High activity genotype-Free environment (CF-HF) orthogonal contrast.
(Node Color: Red indicates under-expression, Green indicates over-expression, Gray indicates genes connecting differentially expressed gene but not differentially expressed in this study; Node Size: larger sizes indicates relatively higher fold changes, while smaller sizes indicates relatively smaller fold changes).

