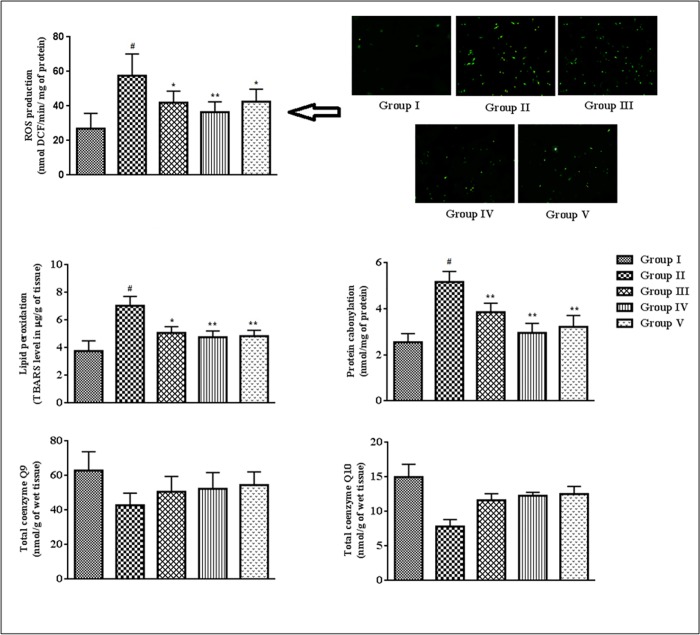
Fig 6. Effect of SR on ROS production, lipid peroxidation, protein carbonylation, coenzymes Q levels in the myocardial tissues of T2D rats.
Data were expressed as mean ± SD (n = 6). $p < 0.05 compared with Group I; #p < 0.01 compared with Group I; *p < 0.05 compared with group II; **p < 0.01 compared with Group II. Group I: Normal control; Group II: T2D control, Group III: T2D rats treated with SR (50 mg/kg, orally); Group IV: T2D rats treated with SR (100 mg/kg, orally); Group V: T2D rats treated with glibenclamide (1 mg/kg, orally).

